

LETTER SERIAL CORRELATION IN ADDITIONAL LANGUAGES
AND VARIOUS TYPES OF TEXTS
2. Discussion of experimental data


by Mark Perakh
Posted on July 2, 1999
CONTENTS
8. Preface
9. Characteristic points on LSC curves
b. Domain of Minimal Letter Variability (DMLV)
10. Depth of minimum (DOM) in various texts
12. Behavior of Specific LSC sums
b. Interpretation of the behavior of the specific LSC sum
c. LSC density and specific LSC sums in Finnish texts
13. LSC in the artificial "zero-entropy text."
14. Behavior of texts obtained by various types of permutation
15. LSC in an artificially created gibberish
16. Uniformity of letter frequency distribution
17. Coefficient of uniformity - an ad-hoc measure of distribution uniformity
18. Entropy ranking of texts
19. Conclusion
20. References
21. Appendix . Calculation of LSC sums and densities for the "zero-entropy text."
8. Preface
In the previous publications [1-3] the Letter Serial Correlation (LSC) phenomenon discovered in Hebrew, Aramaic, English, and Russian texts had been described and in [4] a possible interpretation of the observed regularities of that phenomenon had been offered. In Part 1 of this paper ( http://www.talkreason.org/marperak/Texts/addlang1.htm ) LSC effects in eight more languages as well as in a number of artificially created texts with pre-designed structures, and in texts obtained by various means of permutation of a meaningful text, were described. In this, 2nd and final part, some additional data will be presented and a discussion of these data will be offered. Since Part 1 and Part 2 essentially constitute one paper, the sections, graphs, and tables are all numbered consecutively throughout both parts. To facilitate the navigation through both parts of this paper, hyperlinks are provided where appropriate.
Understanding the following sections requires familiarity with the Letter Serial Correlation as described in [1].
9. Characteristic points on LSC curves
Let us look again at the data presented in Table 1. These measurements were conducted to verify the suggestion made in [1] in regard to the precise location of the Primary Minimum Point (PMP). Most of the measurements in [1] were performed for certain discrete values of chunk's size n. For the Hebrew texts tested in [1] the location of PMP was invariably found at n=20. The only exception was the Samaritan Genesis where PMP was located at n=30. The measurements in [1] were made at n=10, n=20, and n=30, but not at any interim values of n between 20 and 30. It was hypothesized in [1] that the actual location of PMP in all Hebrew texts was somewhere between 20 and 30, and, moreover, it was hypothesized that PMP is associated with the number z of letters in the alphabet, which, for example, in Hebrew is z=22.
To shed light on the above assumption, LSC sums were measured in 12 additional Biblical Hebrew texts, listed in Table 1. In these measurements, the LSC sum was found for a number of values of chunk's size n between n=20 and n=30. In Table 1, the locations of PMP are shown for these 12 additional texts plus Genesis, for which the LSC sums were measured previously [1] and the PMP was found to be approximately at n=20. In Table 1 also the lengths of all 13 texts (expressed in the number of letters) are indicated.
As can be seen in Table 1, the experimental data seem to support the hypothesis suggested in [1]. The PMP in all 13 Hebrew texts were found indeed at or near n=z=22. In seven texts PMP was found exactly at n=z=22, while in two texts it was at n=21, in three texts at n=23, and in one text at n=24.
The hypothesis offered in [4] was based on the observation that in about 80% of the texts explored, the location of PMP was close to n=z. Of course, it is unknown whether the number of letters in the alphabet indeed affects the location of PMP or the values of nmin happen to be close to z just by a chance coincidence. Since such a coincidence was observed in a majority of texts, it seemed worthwile to give it some consideration. For example, in many English texts PMP was found to be at n=30, which is quite close to z=26 in English texts (the measurements in [3] were performed at n=20 and n=30, but not at n=26). In the same English texts stripped of all vowels the PMP often shifted to n=20, which is quite close to the number of consonants in the English alphabet. In the same texts stripped of all consonants PMP usually shifted to n between 7 and 10, which is close to the number of vowels in the English alphabet.
On the other hand, in some English texts PMP was found at n>z (whereas stripping the texts of vowels or consonants always resulted in PMP's shift to lower n).
Additional tests conducted in this study with more languages have often seemed to support the above hypothesis that the location of PMP is somehow connected to the size z of the alphabet. Look at Table 2 where the data are shown for the text of Genesis in 9 languages as well as for the text of short tales in Yiddish (since no Yiddish translation of the book of Genesis was available).
As can be seen from Table 2, in all languages the removal of all vowels from the text inevitably resulted in the shift of PMP to a smaller value of n, which again hints at the relation of the position of PMP to the number of letters in an alphabet. In Spanish, Greek, and Czech translations of the Book of Genesis the location of PMP in all-letter versions was found very close to the corresponding values of n=z (which was n=30 for Spanish and Greek and n=40 for Czech, whose alphabet comprises 41 letters). In the Yiddish text, which was transliterated into Latin characters, using 22 of them, the location of PMP was found at n=20, which again is well in agreement with the hypothesis that PMP occurs close to n=z. In the Spanish, Greek, and Czech texts stripped of vowels, the PMP shifted to the values of n that were very close to the number of consonants in those alphabets (they were found at n=20 for Spanish and Greek, whose alphabets have close to 20 consonants, and at n=30 for Czech whose alphabet comprises 28 consonants). Again, since the measurements were conducted at n=20, n=-30 and n=50, but not at any interim values of n, the coincidence of the PMP location and n=z seems to happen too often to be simply ignored.
On the other hand in Latin, German, and Italian translations of Genesis, PMP was found at n>z (at n=65 in Latin, at n=50 in German, and at n=70 in the Italian all-letters texts). In German and Latin texts stripped of vowels, PMP shifted to lower n (n=30 in German, and n=55 in Latin). In Italian stripped of consonants PMP shifted even more, to n=10.
Furthermore, some additional experiments (conducted by B. McKay) produced results seemingly contradicting the hypothesis in regard to the connection of the PMP location to the number of letters in the alphabet. One such set of experiments was conducted in the following way. In the texts of Moby Dick, War and Peace in English translation, and English translation of the Book of Genesis, all vowels were replaced by letter A and all consonants with letter B. Also, in the Hebrew original of Genesis, all letters Alef, Ayin, Vav, and Yud were replaced by letter Alef and all the rest of the letters by letter Bet. Hence each modified text preserved the original text's length as well as the percentages and relative distributions of vowels vs consonants, but the used alphabets shrank from z=26 for English texts and from z=22 for the Hebrew text, to z=2. If the location of PMP is indeed connected to the value of z, then for the modified texts that location presumably should have shifted to very low values of n. This did not happen. In all three modified English texts PMP happened at n between 70 and 100, and in the modified Hebrew text it was observed at n=30.
This observation by itself does not necessarily mean that the location of PMP is not connected in any way to the value of z. It means though that the available data are insufficient to fully interpret the reasons for the PMP to appear at specific chunk's sizes in various texts. While the notion that in many texts the location of PMP happens to be close to n=z purely by accident cannot be dismissed, it still can be hypothesized that there is a certain connection between the location of PMP and the value of z, but there are other factors which may be relatively weak in many texts thus revealing the effect of z, while in some other texts these other factors may be much more powerful and their role is more profound than that of z.
Let us discuss some of such possible other factors.
b. Domain of Minimal Letter Variability (DMLV)
The shift of PMP to chunk’s size n larger than z can be hypothetically explained, for example, in terms of the size of text’s blocks dealing with certain topics. It seems reasonable to assume that within a block of text dealing with a specific topic certain words appear more often than in the rest of the text. For example, if there is a block of text dealing with properties of apples, word apple is expected to show up in that block with a frequency exceeding that for the rest of the text. Then also letters constituting word apple, such as consonants p and l, would naturally happen more often (per unit of text) in the text block in question than elsewhere in that text. Then within the text block in question the variability of letters is below that for the text as a whole. The next block, say, is about oranges. In that block, consonants r, n, and g, would occur more often than elsewhere in the text, etc. The repetition of the same letters causes the decrease of the LSC sum. This decrease must be especially noticeable for chunk's size n being close to the size of the text's blocks covering specific topics. In particular, for larger n one chunk comprises more than one one-topic block. Therefore, for larger n the variability of letters depends on the number of different topics covered by one chunk.
If the above explanation is true, then the location of the minimum on the LSC curve must depend on the size of text's blocks each covering a specific topic. We may call this text’s feature Verbosity. A larger Verbosity means that in the particular text, larger blocks of text are allocated to cover specific topics. Obviously, the same text in different languages may have different Verbosities. Indeed, in translations of Genesis into various languages, PMP is found at n close to z, for those languages (such as Hebrew) which have, in general, low verbosity, and at n>z for languages normally using more words to cover the same topic (for example German, Latin, and Italian). Within the same language, the Verbosity is determined by the writer’s style. For example, the text of the UN convention on sea trade is distinguished by its heavy officialese, resulting in a large Verbosity. Indeed, in that text PMP was found at n=85, which is the highest value of nmin of all the texts explored.
The above hypothesis cannot though account for all the observed facts. One observation which seems to contradict the above explanation is the small values of n where PMP is observed. For example, in some texts stripped of consonants, PMP was found at n=7. Even doubling that number (since the LSC sum is measured for a pair of neighboring chunks) and even without consonants, no topic could be covered within a text's block that small. Even values such as n=22 (the location of PMP for Hebrew texts) seem to be too small to allow a topic to be covered within just 40 or so letters.
To clarify the described controversy, let us remember that the LSC sum is mainly determined by the variability of letter composition along the text. The closer to each other are the letter compositions of pairs of neighboring chunks, the smaller is the value of Sm m . Obviously, then, at the chunk’s size n corresponding to the location of PMP, the variations among the letter compositions of neighboring chunks are, statistically, minimal. The conclusion directly stemming from this fact is that each text can be characterized by a certain Domain of Minimal Letter Variabilty (DMLV) which is not the same as the size of a segment covering a specific topic, even though it must be somehow connected with the latter. The size of DMLV must be also somehow connected to the Verbosity of the text. Since each term in the LSC sum is that for a pair of neighboring chunks, the size of the DMLV can be hypothesized to equal the double size of a chunk at PMP: DMLV=2nmin. This value, which ranged in the tested texts from 42 to 170 . i.e. between about 4 and 20 words, seems to be too small for the reasonably expected length of text’s blocks covering specific topics. Of course, we have not defined the exact meaning of word "topic." Some narrowly defined subjects can probably take just a few words of the text, thus constituting the DMLV. Whereas the existence of DMLV follows directly from experimental data, its nature remains to be understood. It can possibly be clarified by means of some other specifically designed methods. One such method (we refer to it as LSC2) has been developed and is now being explored.
(In regard to the Italian no-vowels texts, its peculiar behavior described in Part 1 seems to indicate that its no-vowels version stands alone in several respects, its peculiarity related to the relatively high occurrence of consonants "twins." Indeed, in the no-consonants version of the Italian text, where the multiple "twins" were largely eliminated, PMP was found at n=10 which is very close to the number of vowels in that language's alphabet).
10. Depth of Minimum (DOM) in various texts
The Depth of Minimum (DOM) has not been used either in our preceding publications on LSC [1-4 ] or in Part 1 of this paper. It is being introduced here as follows. If the measured LSC sum at n=1 is Sm(1) and its value at the Primary Minimum Point is Sm(min), then the "Depth of Minimum" is defined as
DOM=[Sm(1)-Sm(min)]/Sm(1). ..................(1)
As it will become evident, DOM, along with the locations of the characteristic points, is a characteristic feature of LSC curves. It will be used later on for determining the rank orders of texts entropies.
I would like to point out that DOM is an empirical coefficient, calculated from the values of the measured LSC sum, Sm , at two values of chunk's size n. As such, DOM is not based on any assumptions in regard to the text's properties at n=1 and at nmin but rather simply reflects the observed geometric configuration of the LSC sum's curve at two points. Its possible role as a tool characterizing LSC could be determined only by observing its behavior and noticing whether or not this behavior consistently reflects some evident property of a text.
In Table 5, the values of DOM are shown for 13 Hebrew Biblical texts.
Table 5. Depths of Minimum in 13 Biblical Hebrew texts
|
Text |
Length, L |
DOM |
|
Genesis |
78064 |
0.196 |
|
Exodus |
63529 |
0.194 |
|
Leviticus |
44790 |
0.186 |
|
Numbers |
63530 |
0.196 |
|
Deuteronomy |
54892 |
0.166 |
|
Samuel |
93532 |
0.192 |
|
Kings 1 and 2 |
98467 |
0.200 |
|
Chronicles 1 and 2 |
99478 |
0.212 |
|
Esther |
12111 |
0.202 |
|
Psalms |
78834 |
0.179 |
|
Isaiah |
66888 |
0.160 |
|
Jeremiah |
84912 |
0.168 |
|
Ezekiel |
74499 |
0.170 |
As it can be seen from Table 5, the value of DOM does not seem to be connected to the length of the text.
In Table 6 values of DOM are shown for texts of Genesis in various languages.
Table 6. Depth of Minimum (DOM) for texts of Genesis in various languages
|
Language |
Version |
DOM |
% of vowels in the text |
|
Hebrew |
All letters |
0.196 |
0 |
|
English |
All letters |
0.227 |
37.7 |
|
English |
No-vowels |
0.12 |
0 |
|
Latin |
All letters |
0.188 |
46.4 |
|
Latin |
No-vowels |
0.125 |
0 |
|
German |
All letters |
0.216 |
38.4 |
|
German |
No vowels |
0.125 |
0 |
|
Spanish |
All letters |
0.195 |
52 |
|
Spanish |
No vowels |
0.119 |
0 |
|
Greek |
All letters |
0.193 |
45.3 |
|
Greek |
No-vowels |
0.168 |
0 |
|
Italian |
All letters |
0.108 |
47.8 |
|
Czech |
All letters |
0.153 |
54.6 |
|
Czech |
No-vowels |
0.149 |
0 |
|
Yiddish |
All letters (Latin characters) |
0.278 |
52 |
|
Italian |
No-consonants |
0.060 |
100 |
As we can see from Table 6, texts stripped of vowels all display a smaller value of DOM than corresponding texts in the same language, which contain all letters. In the Italian text stripped of consonants the drop of DOM as compared to the all-letters text is even more drastic. The data in table 6 might be influenced by the various percentage of vowels in texts. To test if this was the case, let us look at the DOM's behavior in various texts written in the same language, so the percentage of vowels is the same for all texts to be compared. Some such data are given in Table 7.
Table 7. DOM in various English and Russian texts.
|
Language |
Text |
Version |
DOM |
|
English |
Hiawatha |
All letters |
0.193 |
|
English |
Hiawatha |
No-vowels |
0.156 |
|
English |
Hiawatha |
No-consonants |
0.136 |
|
English |
Sh. stories |
All letters |
0.168 |
|
English |
Sh. stories |
No-vowels |
0.134 |
|
English |
Sh. stories |
No-consonants |
0.101 |
|
English |
War & Peace |
All letters |
0.166 |
|
English |
War & Peace |
No-vowels |
0.103 |
|
Russian |
Newspaper |
All letters |
0.15 |
|
Russian |
Newspaper |
No-vowels |
0.139 |
|
Russian |
Sh. stories |
All letters |
0.145 |
|
Russian |
Sh. stories |
No vowels |
0.14 |
The data in Table 7 confirm the observation made in regard to Table 6. Again, in the texts, this time other than Genesis, stripped of vowels, or of consonants, the value of DOM systematically decreases as compared to all-letters texts. This time, all three versions of a text in each particular language, contained roughly the same percentage of vowels, inherent in that particular language.
Stripping texts of vowels, or of consonants obviously decreases (and, in the case of no-consonants versions, practically eliminates) the natural redundancy of the text, and is therefore accompanied by the increase of the text’s entropy. Therefore it can be stated that there must be a certain negative correlation between DOM and the text’s entropy.
Similarly, since typically the location nm of the Primary Minimum Point shifts to smaller values of chunk’s size n if a text is stripped of vowels or of consonants, then the value of nm must also negatively correlate with the text’s entropy. Making a note of that observation, I will postpone its further discussion to a later section of this paper.
11. LSC densities behavior
The next step in verifying the regularities of LSC in various languages is to look at the behavior of LSC densities. It was found that for all languages tested, and listed in Table 2, LSC density behaves quite similarly to the four languages studied earlier [1]. Typical examples of a LSC density behavior, namely the dependencies of the logarithms of expected LSC density de and of the measured LSC density dm , on the logarithm of chunk’s size n, for the Latin translation of Genesis, are shown, in Fig. 21 for the all-letters, and in Fig. 22 for the no-vowels versions.
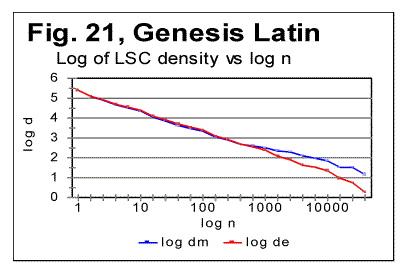
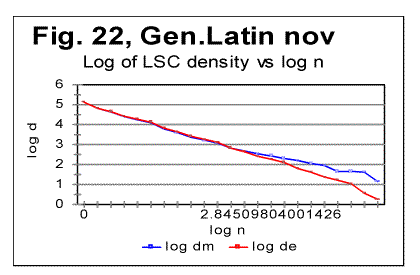
The density curves have the typical shape observed before for the four initially studied languages [1]. On those graphs, as usual, the logarithms of the expected and of the measured densities run very close to each other as long as n<nm (where nm is the location of the Primary Minimum Point) well following the theoretically predicted straight line. At n>nm, the log of the expected sum continues its theoretically foreseen straight-linear run, but log of the measured sum deviates from it, reflecting the increase of the measured sum for a meaningful text as compared with a randomized text. This behavior was discussed earlier [4].
12. Behavior of specific LSC sums
One more way to analyze the LSC is to view the behavior of specific LSC sums. We introduce now the concept of a specific sum as the LSC sum per one letter of the whole text. The expected specific sum is se=Se/L*, and the measured specific sum is sm=Sm/L*, where Se and Sm are the total LSC sums defined in [1], and L* is the actual length of the text used in the calculations and measurements. It equals either the nominal length L of the text (if L is divisible by n) or it is the closest to L number smaller than L, which is divisible by n.
In a certain sense, calculating specific sums means some kind of averaging the LCS sum over L*. The utilization of specific sums eliminates such trivial factor as the effect of the text's length on the LSC sum. It also enables us, among some other things, to plot LSC data for texts of various lengths (for example all-letters and no-vowels versions of the same text) on the same graph thus facilitating their comparison.
A distinction must be made between the LSC density d and specific LSC sum s, as they reflect different properties of the text. Density is defined as the LSC sum per one letter within a chunk. The specific sum is defined as the LSC sum per one letter all over the text’s length. The behavior of these two quantities is quite different. Since the specific LSC sum were not used in the previous publications [1], its behavior will be considered here both in some texts studied earlier and in the Genesis translations being reported in this paper.
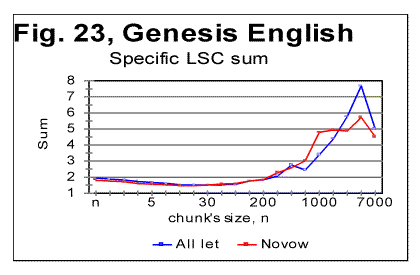
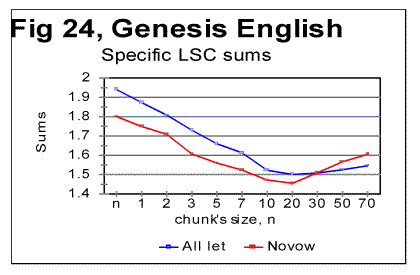
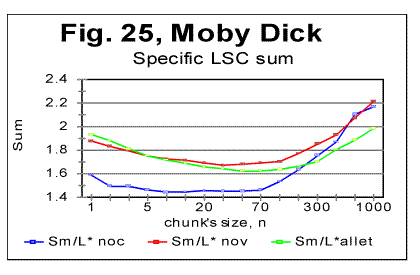
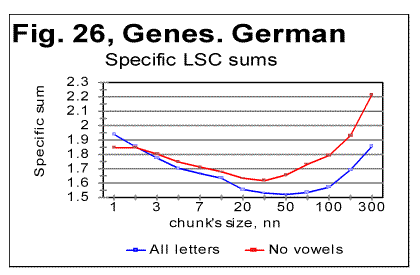
In Fig 23 the graphs of the specific LSC sums are shown for the English translation of Genesis, for the entire range of the tested chunk's sizes (from n=1 to n=10000), and in Fig. 24 the zoomed-in graph is shown for the same specific sums, in the range of n between n=1 and n=100. The blue curves in these graphs represent all-letters versions, and the red curves, the no-vowels versions. In Fig 25 analogous data are presented for the much longer text of Moby Dick, where the curves for all three versions, the all-letters one (green curve) the no-vowels one (the red curve) and the no-consonants one (blue curve) are shown. The behavior of the specific sum as shown in Figs. 23-25 was also observed for the text of Genesis in Spanish, Greek, Latin, and German. As one such example, the specific sums for the German text of Genesis are shown in Fig. 26.
In Hebrew and Aramaic texts, obviously, no comparison could be made between the curves for all-letters and no-vowels versions. The shape of the specific sums' vs n curves in those two languages was though similar to the curves for the other languages tested. The behavior of Italian and Finnish texts of Genesis, which displayed some peculiarities, will be described and discussed in the next section.
In regard to specific sums' behavior in the above listed texts, we notice that in all cases, at small chunk's sizes n, the specific sum sm for the no-vowels version is smaller than it is for the all-letters version. At a certain value of n=p, the curve for the no-vowels version crosses that for the all-letters version, and at n>p, the specific sum sm for the no-vowels version is larger than that for the all-letters version. In that, the behavior of the specific sum sm differs from the behavior of the total LSC sum Sm , which is always larger for the all-letters version than it is for the no-vowels version. The location of n=p where the no-vowels curve crosses the all-letters curve, is different for texts of Genesis in different languages, as well as for different texts in the same language. For example, in the English translation of Genesis, p=35, while in the German text of Genesis it is p=2, and in Moby Dick it is p=5. Our data were not sufficiently complete to make any conclusions as to what is the regularity, if any, governing the value of p for various languages and texts.
A similar behavior was observed for the specific sums for no-consonants versions. While the total LSC sum Sm for a no-consonants version always runs below the sum for no-vowels and even lower in regard to the all-letters versions, the specific sum sm for the no-consonants version runs below the no-vowels and all-letters versions only at relatively small values of n, but as n increases, it crosses, first the curve for the no-vowels, and then also the curve for all-letters versions, as it is illustrated in Fig. 25.
One of the advantages of the specific sum sm compared to the total sum Sm is that the use of the specific sum eliminates the possible influence of the text's length L on the LSC effect and therefore enables us to compare the LSC behavior for texts of various lenghts. Of course, the information gained through the use of both the total LSC sum Sm and the specific LSC sum sm (as well as of the LSC density dm ) complement each other, and all three quantities have their place in the study of different facets of the LSC behavior.
b. Interpretation of the behavior of the specific LSC sum
Removing vowels or consonants means shrinking the alphabet. Then, when moving from chunk #i to chunk #(i+1) there are less choices of different letters in the latter as compared with the former. The less is the number of differing letters in two neighboring chunks, the smaller is the LSC sum. This may explain why the total LSC sum is always smaller in texts stripped of either vowels, or (even more) of consonants (besides the effect of a shorter length of the stripped text as compared with its all-letters version). This factor remains in force for specific sums as well and it is responsible, at least partially, for the specific sum being smaller for no-vowels and no-consonants versions as compared to all-letters version, at small n.
Another effect, which works additionally in the same direction, is as follows. The graphs for sm= Sm/L* are plotted for values of n being equal for all three versions of the text. Equal n means non-equal k (the number of chunks into which the text is divided), as k=L*/n, and L* (the truncated text's length) is always smaller in stripped texts than it is in the all-letter text.
To understand the effect of that factor on the value of s, let us first simplify the problem by assuming that in each chunk each letter appears only once. Then the number of terms (including the zero-value terms) contributed to the LSC sum by any pair of chunks is 2n(k-1)=2n[(L/n)-1] [4]. Obviously, if n is kept identical for two curves, the sum will be less for smaller L*, that is for the stripped texts.
If each letter appears in a chunk more than once, the above calculation must be amended. However that amendment would have only quantitative rather than qualitative effect, so the conclusion that at larger n the number of terms (including zero-value terms) in the LSC sum decreases, remains valid for any number of appearances of a letter in a chunk.
Now let us discuss why, at larger n, the specific sum s=S/L* becomes larger for the stripped texts than it is for the all-letters text. One posible interpretation is as follows. Recall that the total LSC sum Sm, unlike the specific sum sm , is always smaller for the stripped texts than it is for all-letters texts, for all n. Hence, the observed behavior of specific sum sm is due to the division of Sm by L*. The less is the number of letters contributing to the LSC sum, the larger is the role of each individual letter. The specific sum sm , unlike the total sum, reflects the role of individual letters (as does also the LSC density, d, which, though, works in a different way). At small n, when by far not all of the letters of the alphabet can appear in every chunk, the role of those letters that actually appear in a chunk depends little on the number of those letters of the alphabet which remain beyond the chunk. Hence this role depends little on the total size z of the alphabet, since in that range of n, n is just a fraction of z. At larger n, when more letters of the alphabet can appear in each chunk, the relative role of an individual letter acquires a domineering influence on the specific sum. Therefore for stripped texts, which have a shorter alphabet than the all-letters texts have, the role of each individual letter is more substantial than it is for all-letters texts. Hence, unlike the total LSC sum Sm , the specific sum sm grows above that for all-letters text.
One more factor possibly affecting the configuration of the specific LSC sum curves is the relation between the chunk’s size n and the size of text’s blocks covering specific topics (or, more accurately, the size of DMLV). First consider the situation when a chunk’s size is small so each chunk is only a fraction of the DMLV. Then, if the value of n is the same for both specific sums, one for the all-letters text and the other for the no-vowels text, the number of chunks that cover DMLV is smaller for no-vowels text (because of the smaller text’s length L* and hence smaller k=.L*/n in no-vowels text at the same n). Smaller number of the chunks of the same size n means smaller LSC sum. Hence, at small n the curve for the no-vowels version runs below that for the all-letters version. The situation changes when n is larger than the size of DMLV . Since the no-vowels version is always shorter than its all-letters version, then, also the text’s blocks covering specific topics, and hence the DMLV are shorter in the no-vowels version. If chunk’s sizes are the same in both versions, each chunk in the no-vowels version comprises more one-topic segments (or, probably more accurately, DMLV's) which means a larger variability of letters within no-vowels chunks, and, hence, a larger value of the specific sum.
This factor remains hidden in the graphs for the total LSC sums, Sm , even though it may somehow attenuate the growth of Sm at large n. In the case of specific sums, which are obtained by the division of Sm over L*, the smaller L* for no-vowels version enhances the described hypothetical effect rendering it evident on the sm curves.
c. LSC density and specific LSC sums in Finnish texts
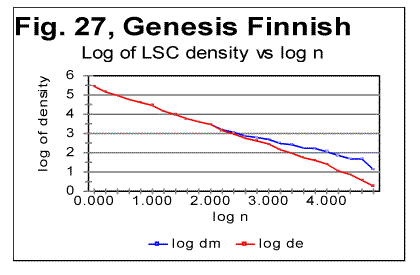
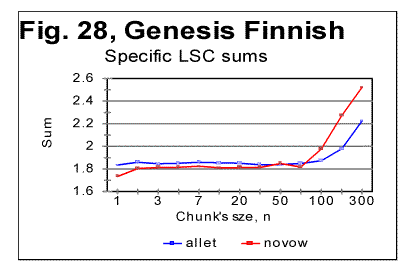
The data for LSC density (as illustrated in Fig. 27 for the all-letters version) in the Finnish texts are quite similar to those observed for other languages. The LSC density, unlike the total LSC sum, reflects the contributions of individual letters, regardless of their belonging to "twins" or standing alone, hence the LSC density naturally behaves in the "twins-rich" Finnish not differently from other languages, which have less "twins" in their texts. Also the specific LSC sums (Fig. 28) in Finnish text behave similarly to other languages. As usual, the specific LSC sum for the no-vowels version, at low n runs below the specific sum for the all-leters version, but around n=p=70 it becomes larger than the specific sum for the all-letter text. The specific LSC sum for the no-consonants version, at low n is below the curve for the no-vowels version, but around n=p=100 it becomes larger than specific LSC sums for both no-vowels and all-letters versions. This is the behavior typical of all tested texts (discussed in detail earlier). The reasons for the specific sums to behave in Finnish in "normal" manner, unlike the total LSC sums, are the same as indicated above for the LSC density's behavior.
Finnish texts, with their abundance of "twins," possess a much larger redundancy, and hence a much lower entropy than the other tested texts. The redundancy of the Italian no-vowels text is slightly lower, and hence its entropy is slightly higher than that of Finnish texts, as it contains less "twins." On the other hand, Hebrew, with its absence of vowels, is expected to possess much less of redundancy, and hence a larger entropy than other tested languages. We may expect that on the entropy scale, Finnish occupies a very low position among the meaningful texts, while Hebrew is at the top of the entropy ladder for meaningful texts. It can be further surmised that the shape of the LSC curves observed in Finnish texts may be a transitional form from meaningful texts to the meaningless "texts" with even lower entropy (an example of such text, referred to as ZET, was shown in Part 1 and discussed below, in section 13). On the other hand, above Hebrew on the entropy ladder may be found meaningless "texts" with a still higher entropy, which nevertheless may produce LSC curves somehow similar to those displayed by meaningful texts. To verify this suggestion, texts presumably located both below Finnish and above Hebrew on the entropy ladder were artificially created.. The results of the tests on such texts are described in the following three sections.
13. LSC in the artificial "zero-entropy text"
The behavior of the three artificially created low-entropy texts was described in Part 1 of this paper. It was shown there that the three texts in question, denoted ZET, LET-1 and LET-2, produced LSC curves of three very different shapes. In view of that observation it is worth mentioning that, even though the entropy of LET-1 is higher than for ZET, and for LET-2 it is higher than for LET-1, these three texts do not form a sequence in which the structure of texts changes gradually, accompanied by a gradual growth of entropy. Actually the structures of the three above low-entropy texts are principally different, as the types of order in those three conglomerates of letters follow three very different patterns.
A natural sequence of texts, starting with ZET, with a gradually increasing entropy, would be such where in each next text that is one step higher on the entropy ladder, the almost perfect order inherent in ZET gradually deteriorates, due to a sporadic appearance of small clusters of disorder (or of a different type of order) within the well-ordered matrix of ZET. When moving up from ZET on that ladder of entropies, one would have a negligible chance to encounter on some step of that ladder either LET-1 or LET-2 , because there is an enormous number of possible variations in letters distributions with low entropies. The three low-entropy texts in question belong to three different "ladders" of entropy, each with a specific type of order, gradually deteriorating in its own manner on its way up the entropy ladder.
On the other hand, if we consider a natural sequence of texts, constituting an entropy ladder at whose bottom is ZET, such that on each next higher step, a text contains slightly more of "alien" clusters, then somewhere, sufficiently high on that ladder, meaningful texts start appearing.
The abundance of letter "twins" in Finnish creates a considerable redundance of that language. Therefore, within the subrange of meaningful texts, Finnish would be found at some very low level of entropy as compared to other languages tested. The abundance of letter "twins" in Finnish may then be considered a remnant of the structure of ZET, where 1000 identical letters appear in a strong order next to each other, hence constituting a chain of multiple "twins" Hence, the LSC curve for Finnish texts (as well as for Italian no-vowels texts) may be expected to preserve some faint remnants of the features observed for ZET. In other words, while LET-1 and LET-2 are at the bottoms of some ladders of texts different from the ladder containing Finnish and no-vowels Italian, ZET may be viewed as, metaphorically, an "ancestor" of Finnish and no-vowels Italian texts.
Speaking metaphorically, among the three artificially created low-entropy texts, only ZET could be considered an "ancestor" of such texts with abundance of letter "twins" as all three versions of Finnish and the no-vowels version of Italian, since ZET comprises a large number of letter "twins," while LET-2 and LET-2, to the contrary, contain no letter "twins." Therefore I will discuss now only the structure and the behavior of ZET.
Since the structure of ZET is precisely known, the LSC sums for it can be precisely calculated. In Appendix, formulas are derived for the calculation of total LSC sums, as well as of LSC densities and of specific LSC sums, in ZET. These formulas are derived in a general form, for arbitrary values of length L and of numbers z of segments. This causes sometimes a certain degree of imprecision of the formulas, discussed in detail in the Appendix. However, the formulas in question were derived not in order to use them for actual calculations, but rather in order to compare them to the measured LSC sums and thus to verify our understanding of both the properties of LSC sums and of the structure of ZET. The calculation using the formulas of Appendix produced results very well confirmed by the actual measurements of LSC sums. For such chunk's size that either m/n or n/m is an integer (as well as for some other, non-integer values of those ratios, discussed in the Appendix), the formulas derived in the Appendix produce precise results. The measured values of Sm at the peaks of the curve shown below in Fig. 29 indeed coincide precisely with the values calculated by the formulas in question.
If the LSC sums Sm are measured for such values of n, that m is not divisible by n (if m>n) or n is not divisible by m (if n>m) the Sm vs n curve becomes more compex in shape, as the values of Sm between the points represented in Fig. 12 deviate from the smoothly ascending (at m>n) or descending (at m<n) curve. For such values of n, the formulas derived in the Appendix, produce some error, while still reflecting correctly the general flow of the graph. Fig. 13 illustrates the shape of the Sm vs n curve, including the points where m/n or n/m are not integers. The formulas derived in the Appendix suggest also that in a log sm vs log n graph, where sm is the specific LSC sum, there will be a peak at n=m, with the curve ascending at n<m and descending at n>m. It also predicts that on both ascending and descending branches, points corresponsing to integer values of m/n (at n<m) or of n/m (at n>m) lie on straight lines, whereas the intermediate points form a zigzaged pattern. This prediction was confirned experimentally, as the results of direct measurements shown in Fig. 29 illustrate.
Now, going back to Fig. 12, we see that in the text with a very low entropy, at n=1 the measured sum Sm is much lower than the expected sum Se (calculated for a randomized text), but, as n increases, the measured sum grows very fast and becomes larger than the expected sum (in our particular ZET it happens at about n=20). Since this experimental result also follows from the theoretically derived calculation, it requires no hypothesis to understand its nature. It is sufficient to follow the derivation in the Appendix to fully clarify the behavior of that LSC sum.
If we look now once again at the graphs for all three Finnish (Figs. 9-11) as well as for the no-vowels Italian texts (Fig. 6), we can see that indeed the "abnormal" behavior of LSC sums for the above texts is, in a certain sense, a "normal" behavior for a text which is, metaphorically speaking, a descendant of ZET. The absence of the Downcross Point in the above texts, and the presense, instead, of an early upcross point seems to be a manifestation of those texts' low entropy, caused by the abundance of letter "twins" in those texts and making them behave in manner similar, even if less pronounced, to the artificial "zero-entropy text." Also, the presence of several minima and maxima on the curve for all-letters Finnish text (Fig. 9) may be viewed as the weakened display of the zigzagged pattern observed for ZET (Fig. 13). Again, since the experimentally observed behavior of ZET was fully predicted by theoretical calculation, the observed "abnormal" LSC curves for the low-entropy meaningful texts require no hypothetical explanations, as they are simply obvious consequences of the text's mathematical structure.
14. Behavior of the texts obtained by various types of permutation
In Part 1 of this paper several versions of texts were described which were obtained from the text of the Book of Genesis in Hebrew by means of various permutations of the text's elements.
In Table 8, characteristic points are shown for LSC curves produced by those three differently permuted versions of the Hebrew Genesis' text ("W/V shuffled" means the text obtained by permuting words within the verses, "V-shuffled" is the text obtained by permuting verses, and "W-shuffled" is the text obtained by permuting words all over the text of Genesis in Hebrew. The abbreviations in that table are [3] DCP - Downcross Point. PMP- Primaty Minumum Point, UCP- Upcross Point, and DOM - Depth of Minimum. In that table, also the quantity introduced in [1] under the name of Degree of Randomness (Dr ) is shown for the same texts.
Table 8. Downcross Points (DCP), Primary Minimum Points (PMP), Upcross Points (UCP), Degrees of Randomness (Dr) and depths of minimum (DOM) for the original Hebrew text of Genesis, and for its randomized versions.
|
Version |
DCP |
PMP |
UCP |
Dr |
DOM |
|
Genesis original |
1-2 |
22 |
120 |
0.2 |
0.194 |
|
W/V shuffled |
1-2 |
25 |
120 |
0.7 |
0.176 |
|
V-shuffled |
1-2 |
10 |
85 |
0.9 |
0.178 |
|
W-shuffled |
2-3 |
30.70, etc |
N/A |
0.91 |
0.168 |
Despite the three texts (besides the original text of Genesis) being permuted versions, and as such, being meaningless conglomerates of characters, all three permuted texts preserve, even if in a distorted and weakened form, certain remnants of the LSC features normally typical of meaningful texts. In particular, on the LSC curves for the three permuted texts we can see Downcross Point, Minimum Point, and Upcross point, which are not as well formed as for meaningful original text, but still may create some confusion while judging the presence of LSC type of order in those texts. Reviewing the data in Table 8, we can see that the measured LSC sums in this case do not provide a clear answer as to whether or not these texts possess LSC like the meaningful texts do. To clarify the uncertainty in question, it turns out to be useful to use some alternative features of LSC.
One such feature is the Degree of Randomness [1]. For the original meaningful text of Genesis text it is Dr=0.2, while for the word-shuffled version it jumps up to Dr=0.91, indicating a rather high degree of randomization for that text (but still lower than for letter-permuted texts [1, part 2].
Another alternative quantity is the Depth of Minimum, DOM. The value of DOM for the word-permuted version (0.168) is below that for the original meaningful text (0.194) reflecting the entropy increase in this text compared to the non-permuted version.
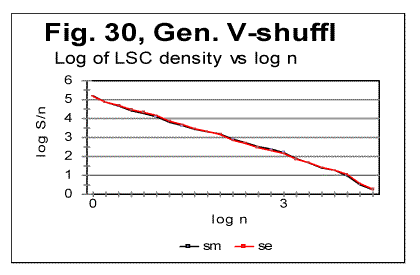
Finally, one more alternative quantity which turned out to be useful for analyzing the LSC in texts, is the measured LSC density introduced in [1]. In Fig. 30 the log of the measured LSC density dm is plotted versus log of chunk's size n. The theoretical prediction [1] was that in a text properly randomized by permutation (letter-permuted) the plot in question should be straightlinear. Indeed, in [1] it was shown that in texts obtained by permuting letters the log dm vs log n curve is represented by a straight line, with a high accuracy. The log-log graph for meaningful texts usually runs very close to that for the randomized text as long as n<nm , where nm is the location of the Primary Minimum Point. At n>nm the curve for meaningful texts invariably deviated from the graph for randomized texts, and ran above the latter. As it can be seen from Fig. 30 below, no such deviation exists for the V-shuffled text. The curves for a properly randomized (e.g. letter-randomized) text and for V-shuffled text run almost identically throught the entire range of n. This shows that theV-shuffled text has lost the features of LSC behavior observed in meaningful texts and is therefore efficiently randomized. This also shows the utility of the quantity we named LSC density, as it sometimes provides information not evident from the LSC sum's observation.
Let us now consider the data for W/V version (Table 8) i.e. for the text created by shuffling words within the verses, without shuffling the verses themselves. The Degree of Randomness for this version turned out to be about Dr=0.7, which is higher than for the original meaningful text, but below the values for W-shuffled and V-shuffled versions. This is in accordance with the appearance of the measured LSC sum's curve (Fig. 16) which preserves some of the features of a curve for meaningful texts despite this text being a meaningless mess of words.
In the W/V-shuffled text also the locations of the Downcross Point (at n between 1 and 2) and of the Upcross Point (at n=120-150) remain about the same as they are in the original meaningful text of Genesis. The location of the Primary Minimum Point, which is at n=22 in the original meaningful text of Genesis, in some of the W/V-shuffled versions shifts to n=30, reflecting the decrease of the degree of order, while in some other W/V permutations it remains at about n=20. Probably, the actual location of that point is between n=20 and n=30, as its precise location was not revealed by having performed our measurements only at n=20 and n=30, and not having measured the sums at points between these two locations. The Depth of Minimum (DOM) which in the original meaningful text of Genesis is DOM=0.194, in the W/V-shuffled versions dropped to about DOM=0.176, thus reflecting a certain diminishing of the degree of order (and hence a slight increase of text's entropy).
The W/V-shuffled text is an actual example of a text which deceptively displays some of the LSC characteristics of a meaningful text (if judging by the shape of the LSC sum's curve) while actually being a gobbledegook (the entropy of this version is slightly higher then it is for the original meaningful text). On the entropy ranks scale this text has to be placed somewhere above the original Hebrew text, but below the W-shuiffled and V-shuffled versions. The entropy ranks scale will be discussed more in detail in another section of this paper.
The concept of DMLV (introduced in one of the preceding sections of this paper) seems to be helpful for the interpretation of the LSC data for texts modified by means of various methods of permutation of the original meaningful text.
Indeed, if a texts is modified by permuting words all over the text, the text blocks covering specific topics, and hence also related to the latter DMLV's that exist in the meaningful original, are completely destroyed. This results in the complete disappearance of the characteristic points on LSC curves, such as PMP etc. In this, the word-permuted version behaves similarly to the letter-permuted one.
To the contrary, if a text is randomized by permuting words within the verses, without permuting the verses, the letters constituting text blocks that cover specific topics remain within the same segments of texts, just being shuffled within those blocks. Hence, in that case DMLV's, even though rearranged, remain intact as a whole. As a result, the W/V shuffled text displays the behavior similar to its meaningful original.
In the case of verses-shuffled text, two extreme situations can be imagined. In one extreme situation, the size of a verse is, on the average, smaller than DMLV. The permutation of such verses is expected to result in destruction of the individual DMLV’s and, hence, in the complete distortion of the shape of the LSC curve as compared with the meaningful original. If though, DMLV is, on the average, smaller than the size of a verse, permutation of verses will result in reshuffling of individual DMLV’s without destroying their structure. In such a case, the LSC curve will have a shape close to that for the meaningful original. In the multitude of intermediate situations, when the size of DLMV is, on the average, close to the size of a verse, the LSC curve for the permuted text will partially preserve some features similar to those for the meaningful original, and partially acquire the features of a randomized text.
15. LSC effect in an artificially created gibberish.
T
he data reported in part 1 of this paper indicated that sometimes meaningless texts may disguise themselves, in regard to LSC effect, as quasi-meaningful texts. In particular, this situation was observed with, first, the text of words shuffled within verses, without shuffling the verses themselves. Secondly, the artificial gibberish produced LSC curves which, superficially, reminded the curves for meaningful texts. Indeed, look at the data for artificial gibberish shown in Figs. 31 and 32.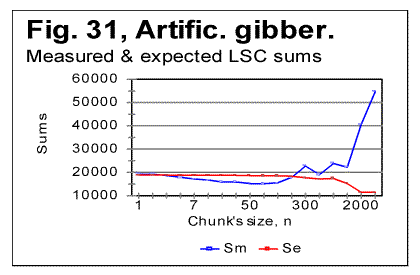
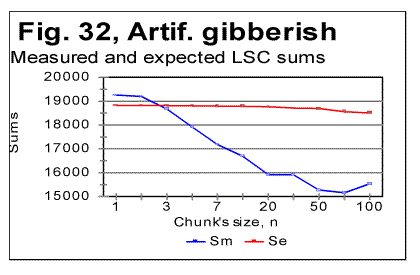
Viewing the graphs in Figs. 31 and 32 reveals that the artificial gibberish, despite its considerably larger degree of randomness, as compared to meaningful texts, displays an LSC effect whose features are similar to those observed in meaningful texts, but not observed in texts randomized by computer-performed letters- or words- permutations. The Downcross Point for the artificial giberish is between n=2 and n=3, the Primary Minimum Point is at n=70, the Upcross Point at n=250, and the depth of minimum is DOM=0.213, all of these numbers being within the ranges observed for meaningful texts. The removal of vowels from the artificial gibberish results in the shift of the PMP and DCP points toward smaller chunk's size, in the same manner it is observed for meaningful texts. The Downcross Point in the no-vowels artificial gibberish remains at the same n between 2 and 3 (as it happens also in some meaningful texts) while the Primary Minimum Point is now at n=30, and Upcross point is at n=150, which is within the range for the meaningful texts. The Depth of Minimum becomes DOM=0.261, which is the shift opposite to that observed in all meaningful texts, apparently reflecting in some, not yet understood way, the difference in the structure between meaningful texts and our artificial gibberish.
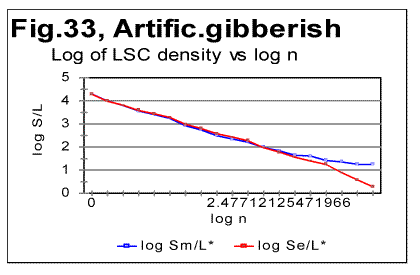
The LSC density for the artificial gibberish behaves, at a first glance, also similarly to meaningful texts (Fig. 32) but with one substantial difference. The deviation of the log of the measured LSC density from log of the expected LSC density, in meaningful texts invariably started close to n=nm (the location of the PMP). In my artificial gibberish this deviation occurred at a much larger value of n (Fig. 33).
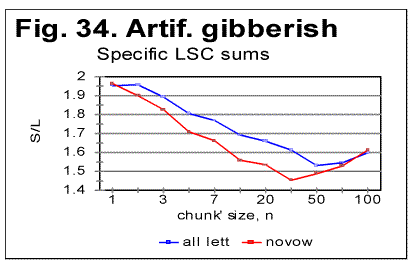
The specific LSC sum curve for the artificial gibberish (Fig.34) displays both similarities to and differences from meaningful texts.
The similarity is in that the specific LSC sum for the no-vowels artificial gibberish runs below the curve for all-letters version as chunk's size n<p, where in this case p=90. This value of p is larger than it is for all meaningful texts tested. At n>p, like in all meaningful texts tested, the specific sum for the no-vowels version becomes larger than it is for the all-letter version, as it was also observed for all meaningful texts tested.
One subtle difference of the specific sum for the artificial gibberish from those for meaningful texts is in that its value at n=1 is slightly above that for all-letters version. In all meaningful texts studied it was below the all-letters version.
The above data show that the features of LSC typical of meaningful text may be still preserved in texts whose randomness considerably exceeds that for meaningful texts, as it is exemplified, first, by the text randomized by permuting words within verses, without pemuting the verses themselves, and, second, by the gibberish which was created manually with an intention to create an almost perfect random text.
However, a little more detailed review of the LSC curves for the artificial gibberish revealed some features quite clearly distinguishing the artificial gibberish from meaningful texts.
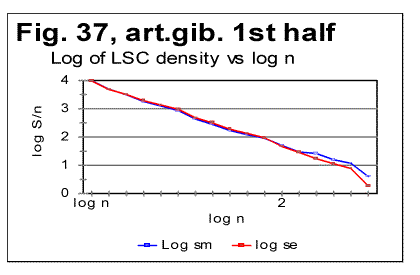
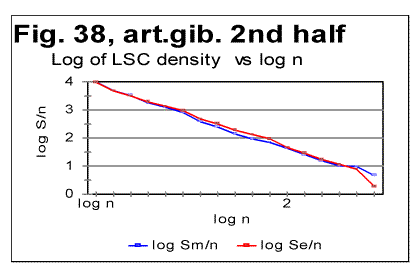
These distinctions have become even more evident when the artificial gibberish which was 10000 letters long, was divided into two equal parts, each 5000 letters long. The LSC curves for these parts of the artificial gibberish ar shown in Figs. 35 and 36, while the data for LSC density and LSC specific sums, in Figs. 37, 38, and 39.
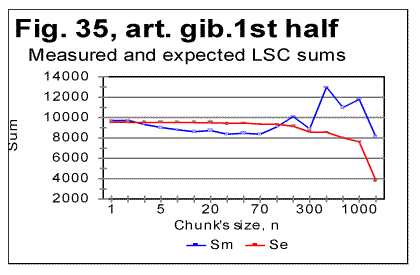
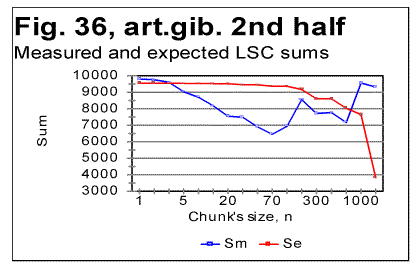
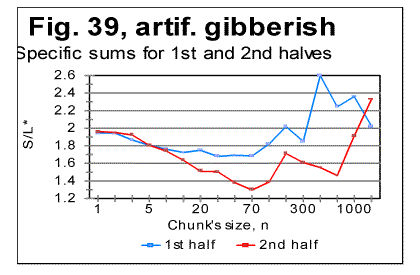
The graphs for specific LSC sums (Fig. 39) reveal the substantial diference between the meaningful texts and my artificial gibberish as far as the LSC is concerned. Indeed, in meaningful texts, dividing the texts into several parts [3] did not result in the curves for specific LSC sum to run over such distinctively different paths as we see it in Fig. 39. Furthermore, the specific LSC sums for meaningful texts invariably had a rather smooth shape, unlike the jumps and zigzagz evident in Fig. 39.
Comment:
When I had compiled the artificial gibberish, I e-mailed it to Dr. B. McKay. After a while, Dr. McKay e-mailed to me the tables of LSC data for two unknown to me texts, each 5000 long, without revealing to me what type of texts those two tables belonged to. He suggested that I guessed if those two texts were in the same language and belonged to the same writer. In did not take long for me to figure out, just by reviewing the LSC data, that those two texts were not meaningful texts (actually they turned out to be two halves of my artificial gibberish). This is one more example showing that the LSC test can serve as a tool to analyze an unknown text and to determine if it is meaningful or a gibberish.Since we discovered that some meaningless "texts" may sometimes produce LSC curves that seem to possess some of the features of LSC curves for meaningful texts (as, for example, the texts created by permuting words within the verses, without permuting the verses themselves) it became desirable to find some criterion which would enable one to determine the boundary between texts displaying LSC curves typical of meaningful texts and those "texts" whose degree of disorder (i.e. the entropy) is sufficient to destroy the features of LSC typical of meaningful texts. This criterion will be suggested in next sections.
Comment. The texts with a very low entropy (such, as, for example ZET described in the preceding section) possess the same two features - the certain percentage of vowels and the uniformity of the letters frequency distribution- as the texts with a high entropy (i.e. the highly randomized texts). Any text whose entropy has a value between that for a very low-entropy- and that for a very high-entropy-texts, has a percentage of vowels higher than it is in the alphabet, and the histogram of letters frequency distribution less uniform than for those two extreme types of text (see also below the data in Table 9 and Fig. 40).
16. Uniformity of letter frequency distribution
Some histograms of letter frequency distribution were shown in Part 1, including one for the artificial gibberish. It was pointed out that the histogram for the artificial gibberish was obviously more uniform than that for a natural meaningful English text. This observation was compatible with the percentage of vowels in my artifical gibberish (25%) which is close to the percentage of vowels in English alphabet (23%) whereas in natural meaningful English texts the percentage of vowels is close to 38%, which is considerably larger than it is in the alphabet. This observation told us that, even though the letter frequency distribution in my gibberish was not as uniform as it would be in a perfectly random text, my artificial gibberish possessed actually a degree of randomness well above that for meaningful natural texts.
Rather than rely on a visual impression, we can estimate the uniformity of a distribution quantitatively.
The standard estimator of a histogram uniformity commonly used in Mathematical Statistics is a quantity referred to as spread whose quantitative measure is Coefficient of Variation (CV) defined as the ratio of the standard deviation to the mean of the distribution [6].
The more uniform is the histogram, the smaller is the spread, i.e. the smaller is the value of the Coefficient of Variation. One of the features of CV is that it automatically compensates for variations in histograms' uniformities caused by various numbers of bins, which in our case are numbers of differing letters in each alphabet. This feature can be considered an advantage as long as the goal of estimate is the uniformity of the distribution per se. In some other cases though, when the uniformity is just a tool for evaluationg some other property of distribution, this feature may be a drawback as it will be discussed in the following section.
Comment. When estimating any property of a distribution, including Coefficient of Variation, a question often arises as to whether different values of the property in question are due to the real differences between different test's objects, or are rather due only to the difference in samplings' sizes. If we wished to test that assumption, we would need to conduct what is known in Math. Statistics as F-test [6]. To this end we would need a matrix of measured frequencies with rows representing different samples of texts in the same language and columns representing frequencies of the individual letters. Such a test is essential in the case of small sample sizes. Fortunately, the sizes of samples in these measurements were large enough to make the F-test unnecessary. Indeed, the letter frequency distribution was found for English using the text of Moby Dick whose length was almost one million letters for its all-letters version and almost 600000 letters for its no-vowels version. For Hebrew, the text used was that of the entire Pentateuch which in its Hebrew original consists of over 300000 letters. Except for Yiddish, the letter frequency distribution for other natural languages was conducted on texts whose length was between 130000 and 155000 letters for their all-letters versions and between 60000 and 100000 letters for their no-vowels versions. For the artificial gibberish the length of the text was 10000 letters. With samples of such size, the values of Coefficient of Variation were very close to the "underlying" values inherent in the particular language and unaffected by the sample size, hence using several equally long samples in each language would result in values of CV differing negligibly from those reported in this paper. Only for Yiddish the length of the text was shorter (close to 5000 letters). Even with a text 5000 letters long, comprising only 22 different letters, the distribution of letter frequencies must be quite close to the "underlying" or "real" one for that language.
In Table 9 the values of the Coefficient of Variation are shown for a number of texts.
Table 9. Coefficient of Variation (CV) for various texts
|
Text |
CV |
|
Czech |
1.046 |
|
German |
1.036 |
|
Spanish |
1.015 |
|
Greek |
0.933 |
|
Finnish |
0.92 |
|
Latin |
0.894 |
|
Russian |
0.888 |
|
English no vowels |
0.866 |
|
Italian |
0.86 |
|
English |
0.834 |
|
Spanish no vowels |
0.833 |
|
Yiddish |
0.811 |
|
Czech no consonants |
0.807 |
|
Latin no vowels |
0.794 |
|
Czech no vowels |
0.766 |
|
Hebrew |
0.749 |
|
Artif. gibberish |
0.425 |
Comment: For the texts obtained by various methods of permutation of the Hebrew text of the Book of Genesis (Word-shuffled, Verses-shuffled and Words-in-Verses shuffled texts) the Coefficient of Variation is the same as it is for the non-permuted original text of Genesis, namely CV=0.749).
As can be seen from the above table, the letter frequency distribution for the artifical gibberish is by far more uniform (a smaller value of CV) than it is for any of the tested meaningful texts in natural languages. This indicates that I succeeded to a considerable extent to create a meaningless text whose randomness approached that for a perfectly random text, which would have CV=0 (zero spread).
Comment: The zero value of CV by itself not necessarily signifies that a text is perfectly random, i.e a text with a high entropy. Indeed, for the low-entropy texts, like ZET described earlier in this paper, the histrogram of letter frequency distribution is also perfectly uniform since all letters in that text are present in equal numbers. In other words, for a zero-entropy text CV=0 as well. If such text is gradually randomized, CV is increasing, reaches maximum at a certain level of randomness and then decreases back to CV=0 for a perfectly random text. Therefore the conclusion that the low value of CV (as it is for the artificial gibberish) means its closeness to a perfectly random text is based implicitly on the plausible assumption that the maximum of CV occurs at a level of randomness below that for the meaningful texts. The plausibility of the above implicit assumption is based on the visual observation of the histograms' uniformity (the histogram for the artificial gibberish is visually clearly more uniform than for any other tested text and has also other features similar to perfectly random texts, such as the percentage of vowels etc).
To summarize the observations described in the preceding sections, I can point out that, overall, any text other than a meaningful one, produced LSC data more or less clearly distinctive from those for meaningful texts. On the other hand, whereas texts created by permuting words all over the text, and even more by permuting letters all over the text, lose completely the features of LSC displayed by meaningful texts, texts created by certain methods of permutations as well as artificially created gibberish may sometimes preserve certain features of LSC imperfectly similar to those observed for meaningful text.
It seems therefore to be of interest to determine the boundary between the texts displaying the LSC features inherent in or at least similar to those of meaningful texts, on the one hand, and the texts whose degree of disorder is sufficient to fully destroy those features, on the other. The criteria for determining such a boundary are discussed in the next section.
17. Coefficient of Uniformity - an ad-hoc measure of the uniformity of frequency distribution
Except for the artificial "zero-entropy text" whose composition and structure are perfectly known, no mathematical models of any other texts is available. Therefore the criterion I intend to introduce to discriminate between the texts displaying the features of LSC typical of meaningful texts and those texts where such LSC features are completely destroyed, will necessarily be of an empirical ("phenomenological") nature, based on the texts' observed behavior rather than on their mathematically modeled structure.
It is possible to indicate several empirical quantities which reflect the degree of order in a text, each in its own way, and none of which individually characterising that degree to the full extent. These quantities include the following items: 1) Uniformity of the letters frequency distribution; 2) The location of the Primary Minimum Point, nmin; 3)The Depth of Minimum, DOM, and 4)The Degree of Randomness coefficient, Dr . The larger is the degree of a text's disorder (i.e the larger is its entropy) the smaller is nmin (with certain exceptions) , the smaller is its DOM, and the larger is its Dr. Of these quantities, the Degree of Randomness Dr behaves in the not always consistent way, apparently being affected by several factors, intertwined in a rather complex and not easily interpreted manner. Therefore I decided not to include Dr into the criterion in question. The combined empirical measure of text's entropy will be introduced in the next section. It will include also a measure of uniformity of letter frequency distribution which I will discuss now.
In regard to uniformity of letter frequency distribution, I postulate that the texts in question are located on such part of the entropy scale where the increase of entropy is accompanied by a decrease in the uniformity of letter frequency distribution, as it was discussed earlier. In the previous sections I used, as an estimator of the uniformity of distribution, the standard measure of spread, namely the Coefficient of Variation CV (see Table 9 and its accompanying explanations). As it was mentioned before, CV automatically eliminates the dependence of the spread on the number of distribution's bins, i.e. in our case, on the various numbers of letters in various alphabets. This was an advantage of CV as long as the estimation of the uniformity per se was the goal. However, in regard to estimating the texts entropies, this feature of CV becomes a drawback since the number z of the letters in an alphabet affects the texts entropies and must therefore be accounted for. Indeed, the maximum entropy of a text (per one letter) measured in bits per letter equals log2z. The actual entropy of a particular text is less than that and it cannot be determined without knowing the exact structure of the particular text. It must though depend somehow on z as well.
Since the Mathematical Statistics does not provide a standard measure of distribution's uniformity being dependent on the number of bins (in our case z) we have to invent some suitable ad hoc measure. I will suggest now such a measure.
The simplest way to define the uniformity of a histogram, which is arranged in such a way that the frequency of its elements increases from left to right, would be just to use the inverse overall gradient , i.e. the ratio of the frequency of the least frequent letter (located at the leftmost edge of the histogram) to the frequency of the most frequent letter (located at the rightmost edge of the histogram). However, it becomes immediately clear that such a ratio, while being simple, is inadequate as a criterion of the histogram's uniformness. Indeed, if there are two histograms having equal overall inverse gradients, the above criterion would be the same for both of them even if, for example, one of those histograms is concave, and the other, convex. Intuitively, we feel that judging such two histograms as possessing the same uniformness would be rather meaningless. In the concave histogram, the overall gradient is realized mainly at the expense of a rather rapid decline (from right to left) of frequencies of the high-frequency letters. In the convex histogram, the overall gradient would be realized mainly at the expense of the rapid drop (from right to left) of frequencies of the low-frequency letters. Intuitively we feel that the proper characteristic of texts in regard to the unifrormness of letters frequency distribution should give a larger weight to the high-frequency letters rather than to the low-frequency letters. Therefore, besides being simple, the criterion of the histograms uniformnes should be somehow biased toward the larger weight of the high-frequency letters' distribution.
One possible way to meet the above requirements is as follows. Calculate three partial inverse gradients for every histogram, these inverse gradients being the following three ratios: R1 is the ratio of the frequency of the least frequent letter (the leftmost one in the Fig. 19 ) to the frequency of the most frequent letter (the rightmost one). R2 is the ratio of the frequency of a letter which occupies the position right in the middle of the histogram, to the frequency of the most frequent letter. Finally, R3 is the ratio of the frequencies of two letters which are equidistant, one from the the left, and the other from the right end of the histogram, such that there is 10 letters between them.
(For the two distributions shown in Figs 19 and 20, these ratios are as follows: For the artificial gibberish R1=0.0938, R2 =0.69, and R3 =0.855. For the regular meaningful English text R1=0.0055, R2=0.199, and R3 =0.323. All three ratios are considerably larger for the artificial gibberish than they are for the meaningful texts. This indicates that I succeeded, even if not fully, to create a text whose randomness distinctively exceeded that for meaningful texts).
Compare now the uniformity of the letter frequency distribution in the artificial gibberish, to that in a number of meaningful texts in various languages. To make the comparison easier, the three above ratios can be combined into one number, which can be then referred to as Coefficient of Uniformity (and denoted CU) for example, as follows:
CU=(R1+R2 +R3)/3.............................(3)
The quantity CU, which is asymmetric (due to the use of R1 and R3, automatically ensuring the larger role of the high-frequency letters) has the above mentioned desirable bias built in.
(Instead of R1 some other inverse gradient could be employed, for example R4 , which is the ratio of the least frequent letter to the frequency of a letter which is right in the middle of the histogram. Then, instead of CU a criterion CU*=R4 +R2 +R3 would be employed. Obviously, R4=R1/R2.
Generally speaking, using R4 instead of R1 could sometimes result in a different order of degrees of uniformity for any two texts, depending on which of the two criteria is used, CU or CU*. Such a contradiction could appear for texts with a rather uniform left end of the histogram, when the role of the low frequency letters is significant.
However, using R4 instead of R1 would mean making CU* symmetric in respect to the histogram, hence eliminating the desirable bias toward the heavier role of high-frequency letters. Therefore, while CU and CU* are equivalent from the abstract mathematical viewpoint, they are not equivalent from the viewpoint of estimating the intuitively meaningful uniformity of the distrinbution, thus making the use of CU preferable over CU*. Finally, the histograms for the texts in question are luckily of such shapes that the replacement of R1 by R4 in our case does not change the order of texts' estimated uniformities.
As a measure of distribution uniformity per se, Coefficient of Uniformity CU is inferior to Coefficient of Variations CV. One of the reasons for that is a certain ambiguity of CU caused by the role of different numbers z of letters in different alphabets. However, as a component of an empirical measure of texts' entropy, CU has an advantage as it incorporates the effect of z on the entropy of particular texts, which would be hard to figure out as a separate contribution to entropy.
In Table 10, the values of CU are shown for a number of meaningful texts, along with the artificial "zero-entropy text" - ZET, with the artificial gibberish, and with the hypothetical "Perfectly Random" text. Both for ZET and for the Perfectly Random text, the coefficient of uniformity, as defined above, is CU=1.
Table 10. Coefficient of Uniformity (CU) of letter frequency distribution in various texts
The following notations in the leftmost column mean the following: I, G, Gc, S, Lc, L, Gr, and C are texts of Genesis in the indicated languages. E is the text of Moby Dick, R is the text of short stories, Y is the text of a combination of very short tales, in the indicated languages.
|
Text |
CU |
|
ZET (z) |
1 |
|
Italian (I) |
0.106 |
|
German all-letters (G) |
0.130 |
|
German no vowels (Gc) |
0.145 |
|
Spanish (S) |
0.149 |
|
Latin no vowels (Lc) |
0.163 |
|
Latin all-letters (L) |
0.169 |
|
Greek (Gr) |
0.174 |
|
English (E) |
0.176 |
|
Finnish (F) |
0.181 |
|
Russian (R) |
0.186 |
|
Czech (C) |
0.221 |
|
Yiddish (Y) |
0.241 |
|
Hebrew (H) |
0.243 |
|
Art. gib (Gb) |
0.546 |
|
Perfectly random (PR) |
1 |
To facilitate the visualization of the range of uniformities, the data from Table 10 are represented graphically in Fig. 40. For both "zero-entropy text" and "perfectly random text" the Coefficient of Uniformity is the same perfect CU=1 For all other texts, both the meaningful ones and the gibberish, CU<1.
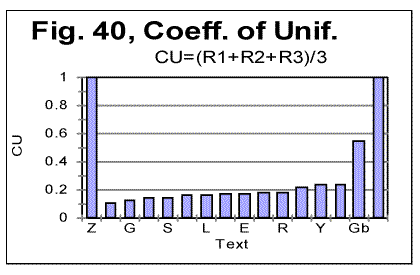
As can be also seen from Table 10 and Fig. 40, the artificial gibberish (Gb) displays degree of uniformity (CU=0.546) which, although below that for the perfectly random text (CU=1), is considerably better than for any of the meaningful texts tested (among which the highest CU=0.243 was observed for Hebrew text of Genesis and the lowest CU=0.106, for the Italian translation of Genesis). This reflects the randomness of the artificial gibberish which exceeds substantially that of meaningful texts.
18. Entropy ranking of texts
Theoretically, the way to calculate the 1st order entropy is as follows. The probabilities of occurrence of individual letters have to be multiplied by the logarithms of these probabilities. The obtained products have to be summed for all z letters of the alphabet.
Such sums could be calculated for randomized texts by assuming that the probabilities in question equal the measured frequencies of letter occurrences. Unfortunately, this does not apply to structured texts, including the meaningful ones.
Furthermore, the total entropy of a texts includes also a multitude of entropies of higher orders. For the 2nd order entropy the sum of products involving the probabilities of occurrence of all digrams has to be calculated, for the 3rd order entropy the sum involving the probabilities of all trigrams is needed, etc. The aggregate entropy of a text must combine all the above sums (divided by entropy orders) for all possible n-tuples of letters. Its calculation is obviously impractical. Therefore, to rank the aggregate entropy of texts, based on their empirically observed behavior, an ad-hoc measure which I call Combined Empirical Entropy Estimator (CEEE) is introduced here as follows.
Having utilized, in the previous sections, several partial empirical criteria of the texts entropy, we will combine them now into one aggregate measure.
I now define a Combined Empirical Entropy Estimator (CEEE) of texts as follows:
CEEE=CU/(DOM×nmin )..........................(4)
The values of CEEE for various texts, including the hypothetical Perfectly Random text (for which obviously CEEE=1) are shown in Table 11.
Table 11. Combined Empirical Entropy Estimator (CEEE) for various texts
The following texts are those of Genesis in various languages or forms: Letter-permuted, Word-permuted, Verse-permuted, Words-in-Verses permuted, and non-permuted Hebrew; German no-vowels, Greek all-letters, Spanish all-letters, Czech all-letters, Latin no-vowels, Latin all-letters, German all-letters, Italian all-letters, Italian no-consonants, Finnish all-letters. English text is that of Moby Dick. Russian text is that of a collection of short stories. Yiddish is the text of a combination of very short tales. Artificial gibberish and artificial zero-entropy texts are described in previous sections. Where not indicated otherwise, the texts are in all-letters version.
|
Text |
CEEE |
|
Perfectly random |
1.0000 |
|
Letter-permuted (estimate) |
0.2000 |
|
Word-permuted |
0.1509 |
|
Verse-permuted |
0.1365 |
|
Artificial gibberish |
0.0697 |
|
Word/verse permuted |
0.0683 |
|
Hebrew |
0.0628 |
|
Russian |
0.0481 |
|
Yiddish |
0.0433 |
|
German, no-vowels |
0.0387 |
|
Greek |
0.0301 |
|
Spanish |
0.0230 |
|
Czech |
0.0200 |
|
Latin, no-vowels |
0.0189 |
|
English |
0.0155 |
|
Latin all letters |
0.0128 |
|
German all letters |
0.0120 |
|
Italian |
0.0078 |
| Finnish | 0.0033 |
| Artificial zero-entropy text |
0.00001 |
As can be seen from the above table, the value of CEEE reflects quite consistently the varying degrees of disorder, decreasing in the table from the top down, from its maximum value CEEE=1 for a perfectly random text, to the minimum value for the "zero-entropy text."
Obviously, the boundary between the texts displaying the features of LSC typical of meaningful texts and those texts where such features are destroyed by disorder, is between lines 4 (verse-permuted texts) and 5 (artificial gibberish). In other words, the above boundary is roughly between CEEE=0.7 and CEEE=0.14. If a certain text has, roughly, CEEE<0.7, its LSC behaves superficially like in a meaningful text, even if this text is actually a gobbledegook. If, roughly, for some text CEEE>0.14, it produces no LSC features like those obseved in meaningful texts. By saying "superficially" I mean that a detailed analysis of LSC data, going beyond the mere observation of total LSC sums, still enables one to distinguish a quasi-meaningful text from a truly meaningful one.
Among the meaningful texts tested, Finnish obviously has the lowest entropy, i.e. the highest redundance, which is due to the abundance of letter "twins." While these "twins" play a certain useful role in the language, indicating some aspects of the pronounciation, they are not necessary for the unequivocal understanding of the text's gist and therefore increase the redundance. As it could be expected, Italian text, with its rather high frequency of "twin" consonants, occupies a position right next to Finnish. On the other extreme of the ranks of entropy we see Hebrew, which has a very small redundancy and therefore occupies a position on the ladder of entropy ranks right next to meaningless texts created by various means of permutation of a meaningful text.
Also, all-letters versions of a text in the same language (exemplified in the table by Latin and German texts) are lower on the ladder of entropy ranks than the no-vowels versions, as it is expected, of course, since stripping the text of vowels substantially diminishes the text's redundance.
Hence, the data in Table 5, which, of course, can be expanded by including many more languages, offer a visual image of the range of entropy for varios texts, from the almost zero entropy for highly ordered combinations of letters, to highly disordered, random collections of letters. Within that very wide range of entropies, the meaningful texts occupy a sub-range, still rather wide, with the values of CEEE roughly between 0.003 and 0.065.
18. Conclusion
In this paper, which is a concluding addition to the previously posted paper in four parts [1], a phenomenon has been described in detail, manifesting the presence of complex ordered structures in meaningful texts, in twelve languages, as well as in certain types of meaningless collections of letters. The studied languages belong to Semitic, Germanic, Latin, Slavic, Finnish and Greek language groups, and all of them displayed the Letter Serial Correlation, qualitatively similar but differing to a certain extent quantitatively. An interpretation of the observed phenomena was offered.
In another paper [2] posted on this Web site, an attempt is described to apply the LSC test to the mysterious medieval text known as Voynich manuscript. While this effort did not result in reading the Voynich manuscript, it may have shed some light on that manuscript's properties and hence may possibly help some other investigators to solve finally the Voynich manuscript's puzzle.
Acknowledgments.
I would like to express my appreciation of the contribution by Dr. B. McKay (of Computer Science Department, Australia National University, Canberra, Australia). Dr. McKay has developed the computer program used for LSC tests, and conducted the measurements of LSC sums. He has also critically discussed with me the interpretation of LSC effect. Of course the responsibility for any weaknesses of the interpretation in question is mine only. I am also grateful to Dr. Gil Kalai (Jerusalem) and Dr. A.M. Hasofer (Australia) for a helpful discussion of some subtleties of the Math. Statistical estimates.
19. References
1-4. Study of LSC in some Hebrew, Aramaic, English, and Russian texts, parts 1,2,3 and 4 - posted on this Web site. (Use the "Back" button on your browser to open the main page on the Texts),
5. Application of LSC test to the Voynich manuscript -posted on this Web site ( http://www.talkreason.org/marperak/Texts/voynich1.htm )
6. Robert V. Hogg and Allen T. Craig, Introduction to Mathematical Statistic, Macmillan Co., New York, 1970.
![]()
20. Appendix: Calculation of LSC sums and densities in the artificially created "zero-entropy text."
Letter Serial Correlation sum can be precisely measured for any text by means of a computer program which has been well tested and used whenever necessary. Therefore, the derivation of formulas for the calculation of LSC in the case of an artificially created text with the nearly-zero entropy is conducted here not in order to use it for actual calculations, but rather in order to verify, by comparing the calculated values with those directly measured, our understanding of the "zero-entropy text" structure and of the properties of the LSC sum.
The term "zero-entropy text" is being used here as short for "near-zero-entropy text." Imagine a text L letters long, where all L letters are identical, for example they all are letter A. The entropy of such text (both the first-order and the higher order entropies) is zero, as there are no probabilities but only certainty in regard to finding which letter is situated at any arbitrary location in the text. If, though, we construct a text, which consist of z segments, all segments of the same length, and each containing only one type of letter (one "token"), with different segments containing different tokens, such a text will have an entropy which is slightly above zero, but so small that for practical purposes we can refer to it as "zero-entropy text."
The text in question is L letters long, and comprises z segments, each segment m letters long, so that m=L*/z where L* is either equal L (if L is divisible by z) or is the nearest lower than L number divisible by z. Each segment contains only one letter token, so in every two neighboring segments letters are different. The text is also divided into k "bins" also referred to as chunks. The size of each chunk is n=L*/k.
We have to distinguish between boundaries between segments (ISB - inter-segment boundaries) and boundaries between chunks (ICB - inter-chunk boundaries). We assume in this consideration that the text runs from left to right, and the consecutive chunks are numbered from 1 to k, while the consecutive segments are identified by letters of the alphabet, so the leftmost segment is A, the second from the left is B, etc.
I will treat the problem in several steps. In the first step I will limit the consideration to the particular situation when either m/n is an integer or n/m is an integer. After that I will extend the calculation to the more general situation when n/m or m/n are not integers.
1. CALCULATION OF LSC SUM IN ZET WHEN EITHER m/n OR n/m ARE INTEGER NUMBERS
Case A: n<m. As said before, first limit the calculation to the situation when m is divisible by n. In this case each segment of length m contains an integer number of "chunks," each chunk being n letters long. All those chunks, which are within the same segment but are not adjacent to the boundaries between the segments, contain the same letter, say letter X. Then these chunks do not contribute any terms other than zero to the Letter Correlation Sum. The chunks which are adjacent to the above boundaries, have as neighbors, on one side, chunks from the adjacent segments, which contain different letters, say letter Y.
Let us assume that chunk #s is the first one (counting from the
beginning of the text) whose right ICB coincides with the first ISB, which means, of
course, that s=m/n. This chunk #s is all within segment A.
However, its neighbor to the right, which is chunk #(s+1), is all situated within
segment B. Therefore the n letters A that are within chunk #s
contribute the term of n2 to the LSC sum. The
same is true for chunk #(s+1) which touches the inter-segment boundary from the
other side and contains letter B. Hence, each ISB contributes the total of 2n2
to the LSC sum. Now calculate the number of ISB’s. Obviously since the number of
segments is L*/m, the number of boundaries is (L*/n)-1 . Then the total
LSC sum is
Sc =2n2
[(L*/m)-1]. ............................(A1)
If m/n is not an integer, then the boundaries between segments do not coincide
with the boundaries between chunks, and the above calculation becomes invalid.
Case B: n>m. Again, limit the calculation on this stage to the case when n is divisible by m, so that n/m is an integer. The boundaries between the chunks are now also boundaries between some of the segments, the latter being smaller than chunks. The number of boundaries between chunks is now (L*/n)-1, and each such boundary between chunks contributes non-zero terms to the LSC sum. Now on each side of a boundary between two chunks there are as many versions of letters as there are m-long segments within each chunk, which number is obviously n/m on each side of the inter-chunk boundary, and the total number of segments with varying letters on both sides of a boundary is 2n/m. Each segment contains m letters, so it contributes the term of m2 to the LSC sum. Hence the total LSC sum in this case is Sc =2n[(L*/n)-1]m2 /m, which is
Sc =2mn[(L*/n)-1]. .................................(A2)
Again, if n/m is not an integer, the boundaries between chunks do not coincide
with boundaries between segments, and the above calculation becomes invalid.
The measurement of Sm showed that for n<=m, when m/n is an integer as well as for m<n when n/m is an integer, the formulas derived above produced the precise values of the measured sums.
2. Calculation of LSC sum in ZET when m/n or n/m are not integer numbers.
Now I will extend the calculation to the more general situation, namely the one where either m/n (for n<m) or n/m (for n>m) are not integers. Introduce the following notations: m/n=s+v, and n/m=r+w, where s and r are integer parts of the expressions m/n and n/m, whereas v and w are their fractional parts. (For example, if m=1000, and n=3, then s=333, and v=0.33333... etc).
Case A: m>n. We start with the case when m>n. Let us mentally count chunks from left to right, starting with chunk #1. As long as the chunks on our way along the text are all within segment A, their pairs do not contribute terms other than zero to the Letter Serial Correlation sum. Suppose that s is such an integer that sn<m, but (s+1)n>m. Obviously, it means that the boundary between segments A and B happens to be somewhere inside chunk #(s+1). Then the boundary between chunks #s and #(s+1) precedes the boundary between segments A and B, by some vn letters, where v<1. This creates a situation in which chunk #s has a different number of letter A, than has chunk #(s+1), and chunk #(s+1) has a different number of letter B than has chunk #(s+2). Namely, chunk #s contains all n of letter A while chunk #(s+1) contains only vn of letter A. On the other hand chunk #(s+1) contains (1-v)n of letter B, while chunk #(s+2) contains all n of letter B. These differences cause the Letter Serial Correlation sum to acquire the following terms:
At the boundary between chunks #s and #(s+1), letter A
contributes a term of (n-vn)2 = (1-v)2n2.
At the same boundary letter B (contained in chunk #(s+1)) also
contributes a term of (1-v)2n2 .
At the boundary between chunks #(s+1) and #(s+2) letter A contributes
a term of v2n2.
Finally, at the boundary between chunks #(s+1) and #(s+2) letter B contributes a
term of
[n-(1-v)n]2 = v2n2
. The total contribution C1 to
the Letter Serial Correlation sum from the vicinity of the ISB between A and B is
then
C1= 2(1-v)2n2+2v2n2.........................(A3)
Continue counting chunks along the text. Chunk #2s will end at a
distance of 2vn before the boundary between segments B and C.
Chunk #3s will end at a distance of 3vn before the boundary between
segments C and D, etc. Generally speaking, chunk #is will end
at a gap of ivn before some ISB. Of course, this trend will continue only as long
as
vi<=1.............................................(A4)
i.e. as long as the gap is not exceeding chunk’s size n.
Then an ISB #i will contribute a term
Ci =2(1-iv)2n2 +2(iv)2n2
.............................(A5)
For all ISB's which conform to condition (4) the total contribution to the LSC sum will be
a partial sum as follows:
.
![]() .............................(A6)
.............................(A6)
The next step is to determine i* - the upper limit of summation. The condition
that determines i* is actually condition (4), which is tantamount to the
assertion that i* is the integer part of the
expression
im =1/v..............................................(A7)
Assume now that vim=1 so that the right boundary of chunk #im coincides
with some of the ISB’s. In this case, starting from chunk #(im+1) the cycle
of gradually increasing gaps will be repeated, until again the increasing gap becomes
equal n, and the cycle starts over again. Note, that in that case the partial sum
Spart is the same in every cycle (possibly
except for the last cycle which can contain less terms than the rest of the cycles). Then,
in order to calculate the total Letter Serial Correlation sum we can simply multiply
expression (4) by the number of cycles within the entire text. This number of cycles
(which is not necessarily an integer) can be calculated be means of dividing the number of
inter-segment boundaries within the text, by the number of chunks within one cycle. The
latter is exactly im in the case of 1/v being an integer or it is i*which
is the integer part of 1/v, i.e. is slightly less than im, if 1/v
is not an integer. Hence, the number of cycles is
j*=(z-1)/i* ........................................(A8)
where i* can be either equal to im (if the latter is an integer) or to
an integer part of im.
Recalling the notations introduced at the beginning of this treatment, we can find that
j*=(z-1)(m-ns)/n...................................(A9)
Now the formula for calculation of Letter Serial Correlation sum, for the artificial
zero-entropy text, for the case when m>n can be summarized as follows:
.
![]() ..............(A10)
..............(A10)
Formula (10) reduces to formula (2) if m is divisible by n, which is the
case formula (2) was derived for.
Formula (2) was precise for m/n being an integer. For m/n being not an integer formula (2) produces a considerable error. Formula (10) eliminates the limitation on m/n to be an integer. Formula (10) is precise if, first, 1/v is an integer. If 1/v is not an integer, formula (10) produces certain error, which though is much smaller than the error of formula (2) for m/n being not an integer.
There is one more source of error in formula (10), although even a smaller one.
It is related to the value of j*. Indeed, quantity j* calculated by
means of expression (9) mathematically can have any number of digits after the decimal
point, depending ultimately on the combination of values of m and n.
Some of those digits simply have no meaning as they reflect fractions of one letter, which
is a meaningless quantity.
If, for example j* turns out to be, say, 3.323, it means the last cycle in the
text is only 0.323 of any other preceding cycle. If the size of a full cycle is, say, 10
letters, then 0.1 of a cycle is one letter, and any fraction smaller than 0.1 has no
meaning. If in such case the value of j*=0.323 is used in formula (10), it will
produce a number slightly higher than the actual LSC sum. This source of error is not
significant.
As to the error produced by the possible non-integer value of 1/v, it
varies depending on the quantity 1/v. For example, if m=1000, and n=3,
then m/n=333.3333... hence v=0.3333 and obviously i*=3. Then
the product i*v is very close to 1 and the error caused by this factor is
negligible. Indeed, the calculation for the artificial zero-entropy text which had
m=1000,
for chunk’s size n=3, produced the LSC sum of 247.76, while the direct
measurement of that sum resulted in its value of 248, which means the imprecision being
less than 0.1%.
In another example, it was chosen n=70, so m/n=1000/70=14.286, hence v=0.286,
and (1/v)=3.496, hence i*=3, and i*v=3*0.286=0.858, which is
less than 1 by [(1-0.858)/1]*100=14.2% which is a considerably larger error (but still
much smaller than the error produced by formula (2) if applied to non-integer m/n).
The resulting error for n=70, stemming from the assumption that 1/v was
an integer was as follows:the calculation using formula (10) produced the LSC sum of 20067
while the direct measurement gave the value of 28800. This result shows the rather wide
range of possible errors when using formula (10). This formula is almost precise if 1/v
is an integer.
It is possible to further pursue the precision of the calculation by considering cycles of the second order, encompassing, as its constituents, the cycles of the first order considered so far. Again, though, the same problem, although on a smaller quantitative scale, will be encountered, as a cycle of the second order may contain either integer or not integer number of cycles of the first order. Introducing cycles of the second order would decrease the possible error, but not eliminate it. Then it could be possible to add, in the same way, cycles of the third order, etc, each such step decreasing the possible error, but, in principle, still not eliminating it completely. Furthermore, by a way of mathematical induction, a general formula could be derived, encompassing an arbitrary number of hypercycles, and enabling us to choose that number in a way necessary to ensure the desired low level of the possible error. Of course, the described effort would be a nice arithmetic exercise, without any discernable practical advantages, since our goal was not to develop a practically convenient method of calculation, but rather to verify our understanding of the texts and of the Letter Serial Correlation sum. Therefore I stopped the derivation at the level of cycles of the first order.
Case B: n>m. Now consider the case when n>m and
n/m is not an integer. Using consideration analogous to that used for deriving
formula (10) the formula for n>m is
as follows:
![]() ................ (A11)
................ (A11)
where
t* = (k-1)(n-mr)/m .....................................(A12)
and i* is the integer part of 1/w.
For n divisible by m, formula (11) reduces to formula (2) derived for that case.
Formula (11) is almost precise when 1/w is an integer. Otherwise it produces some error, which is however less than that of formula (2) if the latter is used for non-integer values of n/m.
As it is expected, for the borderline situation when n=m, all formulas (1), (2), (10), and (11) produce the same value of the LSC sum.
Letter Serial Correlation density
Based on the above formulas, it is possible now to calculate both the Letter
Serial Correlation density dc =Sc/n
and specific Letter Serial Correlation sum sc=Sc/L*.
For m divisible by n, from formula (1):
dc=2n[(L*/m)-1]...............(A13)
and for n divisible by m, similarly:
dc= 2m[(L*/n)-1]...............(A14)
Formula (13) shows that, for m>n, those points on the
dc
vs n curve that correspond to integer values of m/n lie on
straight lines. For n>m this is not true as formula (14) contains
L*/n,
hence the points corresponding to integer values of n/m lie on a hyperbolic
curve. Between the points corresponding to integer values of m/n or n/m,
the curve zigzags in accordance with the following approximate formulas:
For m>n
![]() ......................(A15)
......................(A15)
and for n>m
![]() ....................(A16)
....................(A16)
From equations (15) and (16) follows that points on the curve
dc
vs n, which are between the points corresponding to integer values of m/n
and n/m, lie on a more complex curve, since both j* and t* are
functions of n.
From the above formulas also follows that in log-log coordinates the points on LSC density curve that correspond to integer values of either n/m ot m/n, all lie on straight lines, this straight line ascending for all n<=m and descending for all n>=m. The points between those values of n that pertain to the straight line, form a zigzaged curve. The data obtained by direct measurement (shown in Fig. 29 ) fully conform to that theoretical prediction.
The specific Letter Serial Correlation sums can be calculated simply by dividing expressions (1), (2), (10) and (11) by L*.
The actually measured LSC curves for the sample of a
"nearly-zero-entropy" text behaved in accordance with the predictions based on
formulas derived here. The described results prove that our understanding of both
the structure of the artificial zero-entropy text and of the behavior of Letter Serial
Correlation sum is reasonably close to reality.