


STUDY OF LETTER SERIAL CORRELATION (LSC) IN SOME ENGLISH, HEBREW, ARAMAIC, AND RUSSIAN TEXTS
3. EXPERIMENTAL RESULTS - REAL MEANINGFUL TEXTS


by Mark Perakh and Brendan McKay
Posted on February 9, 1999
CONTENTS
C. Behavior of Letter Serial Correlation sums and densities in real meaningful texts.
a. General desciption of experimental results
b. Example of a raw data table
c. List of the explored texts.
d. Examples of experimental results.
i. Examples of graphs for correlation sums
ii. Examples of graphs for correlation densities
e. Some additional experiments designed to shed light on the phenomena of order in texts.
1. Experiments with various parts of the same text.
2. Experiments with
texts of variable lengths. Artificial long
range order.
The first part of this article (see http://www.talkreason.org/marperak/Texts/Serialcor1.htm ) explained the calculations and measurements of the Letter Serial Correlation (LSC) effect in texts. The second part ( see http://www.talkreason.org/marperak/Texts/Serialcor2.htm ) comprised the experimental results obtained with randomized texts thus providing reference data to be compared with the LSC in real semantically meaningful texts. This, third part of the report contains the results of the experiments with real meaningful texts in several languages. The fourth part (see http://www.talkreason.org/marperak/Texts/Serialcor4.htm ) offers discussion and interpretation of the experimental data. As all four part constitute one article, the figures and tables are numbered continuously throughout all parts, and hyperlinks are provided wherever it is appropriate to facilitate navigation through all four parts of this article.
C. Behavior of Letter Serial correlation sums and densities in real meaningful texts
a. General description of
experimental results
While the previous section (in part 2 of this report) dealt with preliminary
matters, their main thrust being establishing the reference points for analyzing the
Serial Correlation in texts, this section is detailing the main parts of the experiment,
namely the study of that specific type of order in meaningful texts which we refer to as
Letter Serial Correlation.
Preempting our conclusions from the analysis of the experimental data, we can
state already that the real meaningful texts display a very consistent behavior
substantially distinctive as compared with randomized texts. The following two
statements can generalize the observed regularities, to wit:
1) The behavior of the Letter Serial Correlation effect has a number of
consistent features, quite unambiguously distinguishing them from randomized texts, these
features being qualitatively identical for all meaningful texts regardless of their
language, length, style of writing, etc.
2) On the other hand, quantitative characteristics of Lettter Serial Correlation
effect are specific for each language, as well as for different text's length, and in a
certain respect are also contents-sensitive.
Fig 10 depicts schematically the overall shape of the dependence of the measured sum (see eq. A) on the chunk's size, against the background of the analogous dependence of the calculated expected sum.
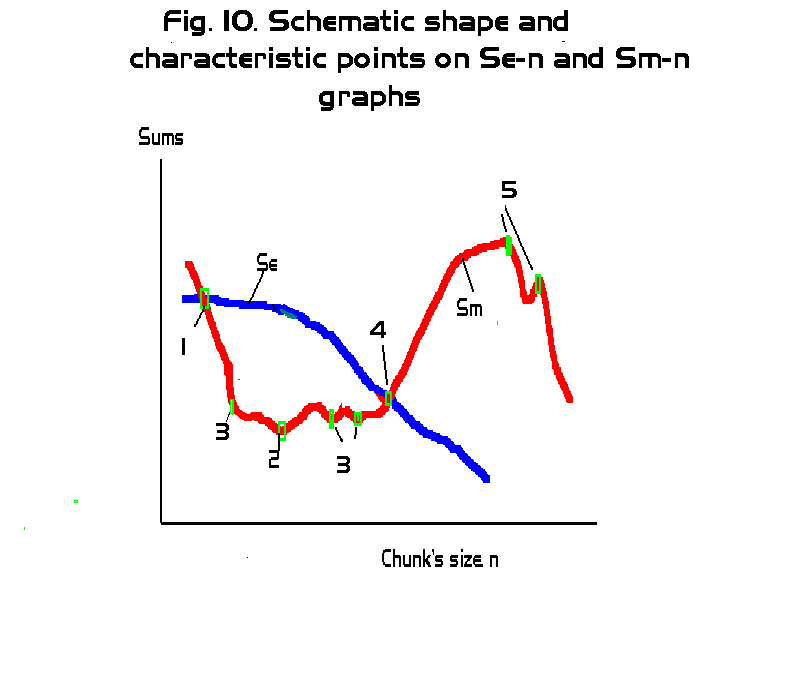
In all the multitude of experiments we conducted, the overall shape of the
dependence in question was in its general features as it is shown in Fig. 10,
regardless of language, text's length, context, writer's style etc. The curves of the
shape shown in Fig. 10 all were obtained for sets of measurements comprising the following
chunk's sizes: 1, 2 ,3, 5, 7, 10, 20, 30, 50, 70, 100, 200, 300, 500, 700, 1000, 2000,
3000, 5000, 7000, and 10000 letters in all texts, and also larger chunk's sizes, up
to n=1000000 in some sufficiently long texts. Consequently, the number k of
chunks into which the texts were divided, varied depending on the total length L
of the tested text.
The characteristic points are indicated in Fig. 10 by small green rectangles
numbered from 1 through 5. The blue curve in Fig. 10 shows the general character of
the expected sum's Se dependence on n, while
the red curve shows the analogous dependence of the measured sum Sm.
In the graph in Fig. 10, in accordance with the manner in which the actual graphs of
measured and expected sums will be presented in this paper, the scale on the abscissa is
meant to be not proportional, with the graduation steps increasing to the right.
There are two types of characteristic points on Smvs
n curve. We will refer to them as type A (points 1, 2, and 4) and type B ( 3
and 5) points. Points of type A are observed on all experimental curves,
regardless of the text's language, length, style, etc. Points of type B may
appear for some texts, and not appear for others. However, the presence or absence
of B-type points is independent of the language or of the length of the texts, but is
rather determined by the individual peculiarities of a particular text, as it will
be discussed later in this paper. In particular, sometimes some fictitious characteristic
points appear which are actually wriggles resulting from the text's truncation, as it was
discussed earlier in this paper. In most cases, it is reasonably easy to distinguish
the real characteristic points which reflect properties of the text, from artifacts which
are just wriggles produced by text's truncation. To this end, besides the curve for Se
vs n dependence, a curve representing the ratio of the measured sum Sm
to the expected sum Se, namely R=Sm/Se
is to be plotted. Since both Sm and Se
are found, one by calculation and the other by measurement, for the same truncated texts,
plotting the ratio Sm/Se
must mitigate the extraneous wriggling observed on the individual Sm
and Se curves. If the curve for R shows
substantially diminished wriggles compared to the individual Sm-n
curve, then it is reasonable to conclude that those wriggles are artifacts
produced by truncation. If, though, the quirks seen on Sm
curve do not show signs of being suppressed on R vs n curve, then
these quirks could be attributed to texts' inherent properties..
Here is a brief description of the characteristic points.
Preliminary comment: If a characteristic point apears at a certain value of n=n*, for example at n*=20, we cannot confidently assert that indeed the corresponding effect (for example, a minimum on the curve in question) occurs exactly at n=n*. Indeed, measurements of Sm and calculations of Se in all cases were performed only for a set of discrete values of n. Hence, if a characteristic point appears at n=20, we can only assert that the actual effect occurs at 10<n<30, since the measurements and calculations were performed only for n=10, n=20, and n=30, but not for any values of n between 10 and 20, or between 20 and 30. Hence, if a minimum appears on the graph at n=20, its actual position may be, for example, at n=17 or at n=25 as well.
Point 1. In all experiments conducted, without a single exception, the value of Sm for k=L i.e. for n=1, is larger than the expected value Se . As the number k of chunks decreases, hence the size n of a chunk increases, Sm decreases and soon becomes smaller than Se . Characteristic point 1 is at that value of n where the curve for Sm crosses the curve for Se. We will refer to this point as Downcross point (DCP). The presence of DCP, observed so far for all explored meaningful texts, distinguishes their behavior from that of the texts randomised by permutations, which do not display such a consistent feature.
Point 2. The curve for Sm reaches a minimum at a certain value of n which is denoted in Fig. 13 as characteristic point 2. It is observed in all experiments, regardles of language, text's length etc, thus clearly distinguishing the behavior of a meaningful text from the texts randomized by permutations, which do not display such a minimum. We will refer to this point as Primary Minimum Point (PMP).
Point 4. As the curve for the measured sum Sm passes point 2 of minimum, the value of Sm starts increasing. At a certain crossover point, denoted point 4 in Fig. 13, the curve for Sm crosses that for the expected sum Se and for n larger than at point 4, Sm continues to grow staying above Se. That crossover point which will be referred to as Upcross Point (UCP) is observed in all experiments, regardless of language, text's length, etc. Its presence clearly distinguishes the data for meaningful texts from those for texts randomized by permutations, where no such consistently appearing UCP is observed.
Point 3. In some experiments, at certain values of n which may be either smaller or larger than that for point 2, additional local minima appear on the curve for Sm. The appearance of such additional minima differs clearly from the random fluctuations of Sm in the graphs for texts randomized by permutations. In some texts also a secondary up-cross point may be observed, also clearly distinctive from random fluctuations of Sm observed for texts randomized by permutations. Some of the secondary minima/maxima or up-cross points are artifacts caused by the truncation of texts for some values of n. However, even after the artifacts have been filtered out (as it will be described later in this article) some secondary minima or upcross points remain intact. The nature of these secondary local minima and crossovers will be discussed in Part 4 ( http://www.talkreason.org/marperak/Texts/Serialcor4.htm ) of this paper.
Point 5. The LSC sum's curves for some texts have a peak, and more rarely, two closely located peaks at rather large values of n. These peak points are indicated in Fig. 10 as point 5. We will refer to them as Peak Points (PKP). They are clearly distinctive from random fluctuations observed for texts randomized by permutations.
The following is a detailed report on the experimental results obtained for real meaningful texts in four languages (Hebrew, Aramaic, English, and Russian). It will be accompanied by a partially concomitant and partially subsequent discussion in regard to the suggested interpretations of the observed regularities.
b. Example of a raw data table
In Table 3 an example of row data is shown. The leftmost column contains the chunk's sizes, the next column shows the number k of chunks the text (in this example the English translation of the Book of Genesis) was divided into, then a column shows the values of Serial Correlation sum measured (see formula A), the next column lists the values of expected Serial Correlation sum, calculated using formula (13B), and, finally, the rightmost column shows the values of the ratio R=Sm/Se. Such tables have been obtained for all tested texts and used for the analysis of the texts' behavior.
Table 3. Row data for
Genesis, English, L=151836
n |
k |
Sm |
Se |
R = Sm/Se |
1 |
151836 |
294568 |
282523 |
1.043 |
2 |
75918 |
284402 |
282521 |
1.007 |
3 |
50612 |
274690 |
282519 |
0.972 |
5 |
30367 |
262736 |
282513 |
0.930 |
7 |
21690 |
251900 |
282500 |
0.892 |
10 |
15183 |
244848 |
282494 |
0.867 |
20 |
7591 |
231060 |
282457 |
0.818 |
30 |
5061 |
227898 |
282457 |
0.807 |
50 |
3036 |
229050 |
282363 |
0.811 |
70 |
2169 |
231600 |
282383 |
0.820 |
100 |
1518 |
234702 |
282270 |
0.831 |
200 |
759 |
266628 |
282084 |
0.945 |
300 |
506 |
279168 |
281898 |
0.990 |
500 |
303 |
313802 |
280960 |
1.117 |
700 |
216 |
357110 |
280028 |
1.275 |
1000 |
151 |
368712 |
279095 |
1.321 |
2000 |
75 |
509268 |
275368 |
1.849 |
3000 |
50 |
656052 |
273508 |
2.399 |
5000 |
30 |
865642 |
269786 |
3.209 |
7000 |
21 |
1132062 |
260469 |
4.346 |
10000 |
15 |
750890 |
260482 |
0.288 |
All graphs shown in this article has been plotted using the data from the tables similar to table 3.
c. List of the explored texts
Table 4 lists all texts that have been so far subjected to study.
For a number of titles in Table 4, several versions are listed. The versions of the same text differed in that one of them preserved the original form of the text, while in other versions the texts were stripped either of all vowels or of all consonants. The exploration of such only-consonants and only-vowels texts was first initiated as an attempt to occasionally analyze the possible role of the absence of vowels in Hebrew texts in causing the observed differences between the behavior of LSC in Hebrew and non-Hebrew texts. In the course of experiments it became evident that exploration of only-vowels and only-consonants texts may provide an information beyond the mere comparison with Hebrew texts, so this approach had become a regular facet of the study.
In Table 4 the second column from the left lists the titles of the studied texts. War and Peace is the title of a novel by Russian writer L. Tolstoy. Moby Dick is the title of a novel by H. Melville. Macbeth is a play by W. Shakespeare. Hiawatha means the poem by H. Longfellow titled The Song of Hiawatha. Short stores 1 and Short stories 2 are collections of short stories by one of the authors of this article. Newspaper means the issue of October 16, 1998 of a newspaper Argumenty i Facty published in Moscow, Russia. The rest of the titles are self explanatory.
The third column indicates the language of the text.
In the fourth column letter O means that the text is in its original language, letter T means that the text is a translation from its original language, and letter P means that the text is partially in its original and partly in its translated version. The original languages are as follows: The original language of the Book of Genesis, of the entire Torah, and of the Mishna was Hebrew. The original languages of theTalmud were Hebrew and partly Aramaic. The original language of L. Tolstoy's novel War and Peace was Russian. Short stories 1 is a text in English about one half of which was originally written by one of the authors of this article in English and the other half was originally written in Russian and then was translated by the writer into English. Short stories 2 is a Russian text which is by about 75 % the same as Short stories 1, one half of it originally written in Russian and the other half translated from its English original. The newspaper is the issue of October 16, 1998 of Argumenty i Facty published in Russian in Moscow.
The fifth columns lists the texts' lengths in terms of the number of letters.
The sixth column contains references 1 through 6 to the following comments:
1. The translation into English of the entire text of the Book of Genesis.
2. Text that has been stripped of vowels.
3. The Samaritan version of the Book of Genesis
4. The initial part of the novel containing as many letters as the Hebrew text of the Book of Genesis.
5. The entire text,
6. Text that has been stripped of consonants.
7. The initial part of the novel whose length covers the same material as the first 78064 letters of the Hebrew translation of that novel.
Table 4. List of the studied texts
No |
Title |
Language |
O or T |
Length |
Comment |
1 |
Genesis |
Hebrew |
O |
78064 |
5 |
2 |
Genesis |
English |
T |
151836 |
1,5 |
3 |
Genesis |
English |
T |
99493 |
2,5 |
4 |
Genesis |
Aramaic |
T |
88402 |
5 |
5 |
Genesis |
Hebrew |
O |
79795 |
3,5 |
6 |
Torah |
Hebrew |
O |
304805 |
5 |
7 |
Torah |
Aramaic |
T |
349145 |
5 |
8 |
Mishna |
Hebrew |
O |
795468 |
5 |
9 |
Talmud |
Heb+Aram. |
O |
7406157 |
5 |
10 |
War and Peace |
Hebrew |
T |
78064 |
4 |
11 |
War and Peace |
English |
T |
2514457 |
5 |
12 |
War and Peace |
English |
T |
1567987 |
2,5 |
13 |
War and Peace |
English |
T |
946470 |
2,6 |
14 |
War and Peace |
English |
T |
107100 |
7 |
15 |
War and Peace |
English |
T |
66094 |
2,7 |
16 |
War and Peace |
English |
T |
41006 |
6,7 |
17 |
Moby Dick |
English |
O |
924956 |
5 |
18 |
Moby Dick |
English |
O |
578641 |
2,5 |
19 |
Moby Dick |
English |
O |
346315 |
5,6 |
20 |
UN Sea trade conv. |
English |
O |
362979 |
5 |
21 |
UN Sea trade conv. |
English |
O |
221548 |
2,5 |
22 |
UN Sea trade conv. |
English |
O |
141431 |
5,6 |
23 |
Macbeth |
English |
O |
77553 |
5 |
24 |
Macbeth |
English |
O |
48096 |
2,5 |
25 |
Macbeth |
English |
O |
28647 |
5,6 |
26 |
Hiawatha |
English |
O |
141399 |
5 |
27 |
Hiawatha |
English |
O |
89087 |
2,5 |
28 |
Hiawatha |
English |
O |
52312 |
5,6 |
29 |
Short stories1 |
English |
P |
133330 |
5 |
30 |
Short stories 1 |
English |
P |
82663 |
2,5 |
31 |
Short stories 1 |
English |
P |
52667 |
5,6 |
32 |
Short stories 2 |
Russian |
P |
127114 |
5 |
33 |
Short stories 2 |
Russian |
P |
68012 |
2,5 |
34 |
Newspaper |
Russian |
O |
99035 |
5 |
35 |
Newspaper |
Russian |
O |
56433 |
2,5 |
d. Examples of experimental results
i. Examples of graphs for correlation sums
Since we have plotted hundreds of graphs representing the LSC for different texts, it is impractical to show all of them. Therefore we will present in this section only a few typical examples of experimentally obtained graphs, and then we will summarize the results in a tabulated form.
In Fig. 11 the measured (blue curve) and expected (red curve) sums are presented for the Hebrew text of the Book of Genesis. The downcross point, the minimum point, the upcross point, and the peak point are quite distinctive and make the Sm -n curve for that text clearly different from curves observed for randomized texts. To pinpoint the location of the mentioned characteristic points, zoomed-in graphs are helpful. One such is shown in Fig. 12. In that figure the downcross point, the minimum point, and the upcross point can be easily identified to be at n between 1 and 2 (downcross), at n=20 (minimum) and at n=120 (upcross).
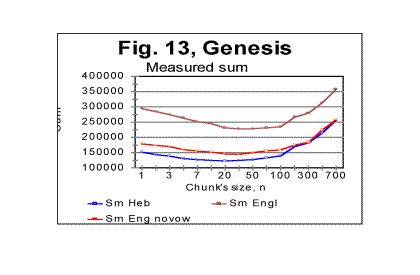
In Fig 13, measured sums are shown for the text of Genesis in Hebrew (blue curve) as well as in English, the latter in two versions, one the regular English text (brown curve) and the other a text stripped of vowels (red curve). It is clearly seen from the zoomed-in graphs (not shown here) that while the minimum point for the Hebrew text is at n=20, for the regular English text it is at n=30, and for the English text without vowels the minimum points is at about n=20. Overall the measured sum for the English text stripped of vowels approaches the curve for the Hebrew text. To locate upcross points, it is more convenient to plot the ratio R= Sm/Se which is shown for the text of Genesis in Fig. 14 where the blue curve is for the Hebrew original of Genesis, the brown curve is for the regular text of English translation, and the red curve is for the English text stripped of vowels.
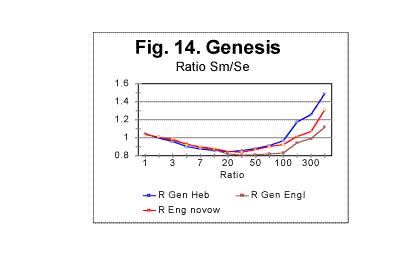
From Fig. 14 (and more precisely from the corresponding zoomed-in curves) the upcross points for these texts (which are where the ascending curve for R crosses the value of 1) were located at n=120 for the Hebrew original, at about n=400 for the regular English text, and at n=180 for the English text stripped of vowels.
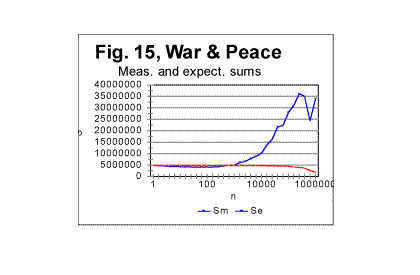
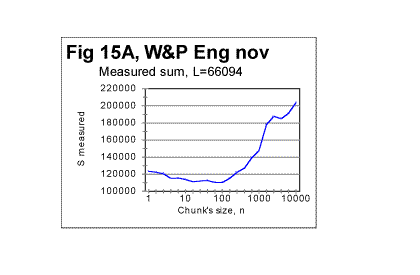
In Fig. 15 another sample of Serial Correlation sums, both measured (blue curve) and expected (red curve) is shown, this time for the entire text of the English translation of War and Peace, with chunks' size up to 1000000. From zoomed-in graphs (not shown here) the downcross point in this case was between n=2 and n=3, the minimum point at n=50, the upcross point at n=400 and the peak point at n=7000. Fig 15A shows the measured letter correlation sum for the partial English text of War and Peace, whose length was 107100 letters, and which was stripped of vowels (so that its length decreased to 66094 letters) for the chunks' size up to 10000. Fig. 15a illustrates the situation when there are several minima on the measured sum's curve (in this case at n=5, n=20, n=100, and n=5000). As it was discussed earlier in this paper, juxtaposing these minima to the corresponding locations on the curve for the expected sum, it is possible to distinguish between the real minima of the measured sum and artifacts caused by the text truncation. In this particular example it was determined that the minima at n=20 and n=100 are real characteristic points of the measured sum, while the secondary minima at n=5, n=70, and n=5000 are artifacts caused by the text's truncation.
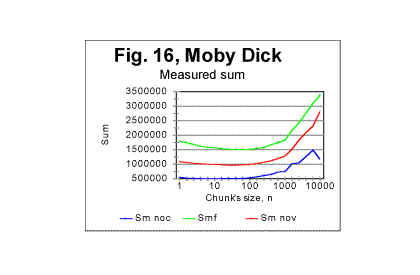
In Fig 16, measured sums are shown for the entire text of Moby Dick, with chunks size up to 10000, for the regular text (green curve) and for texts stripped of vowels (red curve) or of consonants (blue curve). Using zoomed-in graphs, the characteristic points were located for these graphs, which all will be listed in a table later in this article. The effect of vowels' or consonants' removal on the measured sums will be discussed later in this article.
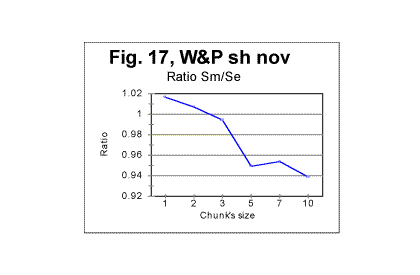
Fig. 17 is an example of a zoomed-in curve for ratio Sm/Se for the partial text of War and Peace, whose length was 78064 letters and which was stripped of vowels. The quirk at n=5 indicates that the minimum which is observed at n=5 on the curve for the measured sum (see Fig. 15A) is a real characteristic point and not an artifact caused by the text's truncation. (In the case of an artifact of the described type, the curve for the ratio remains smooth at those n where the curve for the measured sum displays a wriggle).
We will wrap up our presentation of sample curves for Letter Serial Correlation sums and their ratios by showing data for some Russian texts and their equivalents in English. In Fig. 18, 19, 20, and 21 the serial correlation sums are shown for the set of short stories in Russian (Figs. 18 and 19) and for the analogous text in English (Figs 20 and 21), both for regular texts (Figs 18 and 20) and for texts sripped of vowels (Figs. 19 and 21).
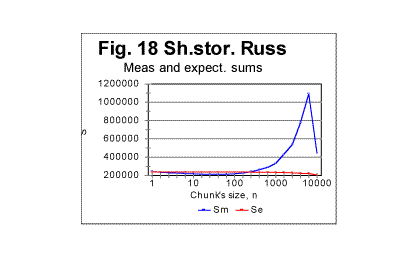
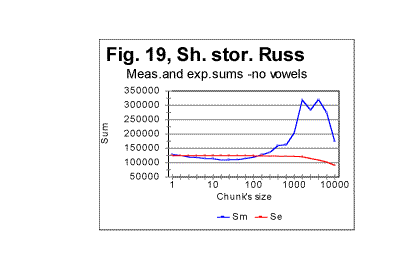
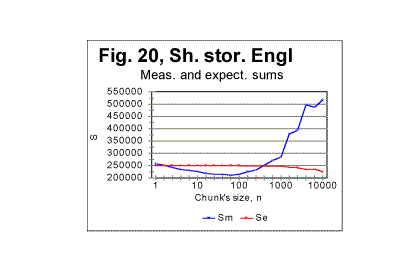
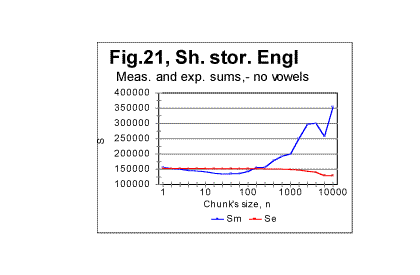
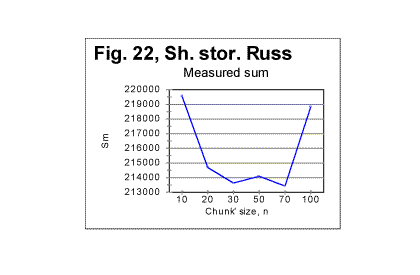
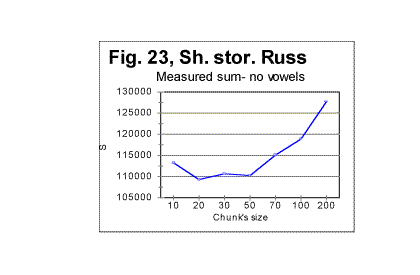
Reviewing the graphs exemplified by the above four figures enables us to analyze the dependence of the Letter Serial Correlation on language and on the vowels' presence in the text. While the general discussion of all the observed regularities will be offered later in this article, we may state already that the overall character of the LSC effect is the same in both Russian and English texts, as well as both in regular texts and texts stripped of vowels. However, there are quantitative variations between texts written in different languages and between regular texts vs texts stripped of vowels. The effect of vowels removal manifests itself through very similar features in both English and Russian texts. In Figs. 22 and 23 zoomed-in graphs of the measured sum are shown for Russian texts, both regular (Fig.22) and stripped of vowels (Fig. 23). Such zoomed-in plots make it easier to pinpoint the characteristic points, in this example the minimum points. While in the regular text the minima are observed at n=30 and n=70, in the text stripped of vowels the minima shift to n=20 and n=50. The interpretation of these data will be given in part 4 of this article ( see http://www.talkreason.org/marperak/Texts/Serialcor4.htm ).
ii. Examples of graphs for correlation densities
We will present here examples of correlation densities data for two texts, namely for the Hebrew original of the Torah, and for the English original of Moby Dick. In Fig. 24 the curve for the measured density is shown for the text of the Torah. The curve for the measured sum Sm for that text (not shown here) has a distinctive minimum at n=20 (likewise the analogous curve for the text of Genesis - see Fig. 11 and 12). On the other hand, on the curve for the measured density dm in Fig. 24, the minimum is not evident. However, there is actually a peculiariry at n=20 which becomes obvious if a plot is considered of logarithm of density vs logarithm of chunk's size n. Two log-log curves are shown in Fig. 25, one for logarithm of the expected density - log(de)=log(Se/n) vs log n (red curve), and the other for the logarithm of the measured density- log(dm)=log (Sm/n) vs log n (blue curve).
As it can be seen in Fig. 25, the graph for the expected sum, in agreement with prevously discussed data for expected sums, looks like a straight line over the entire range of chunk's sizes. Indeed, this line (which is an almost hyperbolic curve in de-n coordinates) is represented by the following regression-generated equation (with the correlation coefficient of k=0.9992):
de=597960Śn-1.021
On the other hand, the curve for the measured density seems to consist of two parts. Since the measured sum for this text has a minimum at n=20, it seemed reasonable to expect that the point at which the initial part of the curve - that with a steeper slope - converts into the second part that has a shallower slope, is located also at n=20. Indeed, the calculation showed that for n<20 the curve is very well represented by a straight line with a slope of -1.073 while at n>20 it is as well represented by another straight line with a smaller slope of -0.732. The equations of those two curves in dm-n coordinates (where they are almost hyperbolic curves) are as follows:
At n<20 dm=593008Śn-1. 073 (correlation coefficient k=0.99992)
and
at n>20 dm=483920Śn-0.732 (correlation coefficient k=0.9965)
Qualitatively analogous results were observed for all studied texts. For example, in Fig. 26 the log-log graphs are shown for the expected (red curve) and measured (blue curve) correlation densities, for an English text, in this example that of Moby Dick.
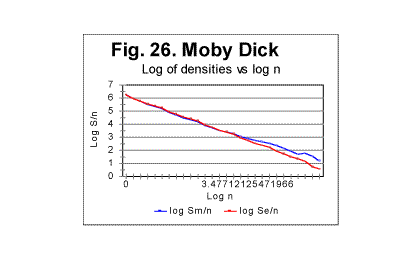
For the Moby Dick text, the demarcation between the initial , steeper, and the subsequent, less steep parts of the graph for the measured density, occurs at n=50.
The equations that describe the curves in Fig 26 (all of them represent almost hyperbolic curves in de-n and dm-n coordinates) are as follows:
For the expected density, de=1729189Śn-1.019 (correlation coefficient k=0.99973);
For the measured density at n<50, dm=1788292Śn-1.05 (correlation coefficient k=0.99995);
For the measured density at n>50, dm=1500610Śn-0.82 (correlation coefficient k=0.9978).
In the case of Moby Dick, the curve for the measured sum had more than one minimum. However, only at n=50 the minimum on the curve for the sum is accompanied by a measurable change in the slope of the curve for the measured density. This fact provides one of the criteria for interpreting the minima on the curves for the measured sum, distinguishing minima of different origin, as it will be discussed in part 4 of this article.
As it has been said before, the graphs shown in this section are just a fraction of several hundreds of analogous graphs obtained in our experiments.
e. Some additional experiments designed to shed light on the phenomena of order in texts
1. Experiments with various parts of the same text
It seemed reasonable to assume that the shape of the experimental curves for the LSC is affected by a number of various factors (which will be discussed in detail in the fourth part of this article - see http://www.talkreason.org/marperak/Texts/Serialcor4.htm ). A common way to study the role of various factors is to vary only one of them, trying, if it is possible, to keep the rest of the factors constant. One such attempt in this study was to isolate the role of the semantic contents of the text. To this end, in one of the experiments the entire English text of War and Peace was divided into 23 equal segments and the measurement and calculation of serial correlation sums were performed for each of those segments. The segments in question did not differ either in language, or in length, or in the authorship, but since they were various parts of the same novel they differed in contents, and hence in the sets of letters occurring in each segment.
The length of each segment was 107100 letters. The maximum size of a chunk for each segment was chosen to be 10000.
In Fig. 27, the serial correlation sums are shown, as an example, found for segment #3. The curves for all other segments were found to be of similar shape. The downcross point for all 23 segments was found to occur at the same n, namely between n=2 and n=3. As to the locations of the minimum point and of the upcross point, they varied between segments. In Fig 28, a diagram is shown for the minimum points and in Fig 29, a diagram for upcross point, for all 23 segments.
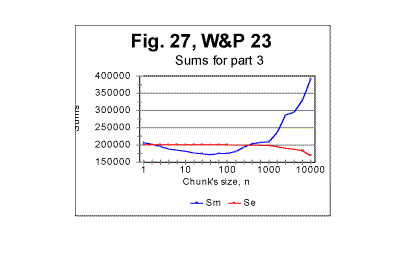
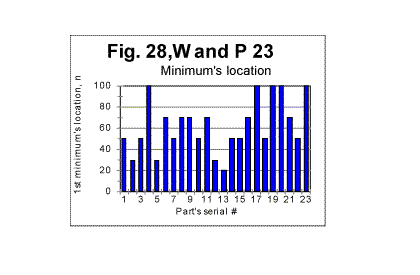
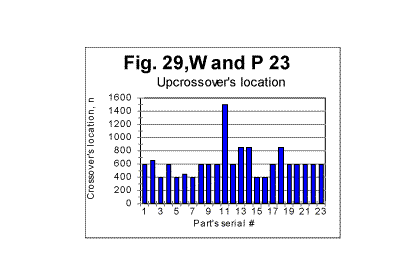
The diagrams show the variations in locations of both minimum point's and upcross point's locations caused by the semantic contents variations between various segments of the text. In Figs 29 and 30, histograms are shown illustrating the frequency distributions of the minimum point and of the upcross point among the 23 segments of the novel.
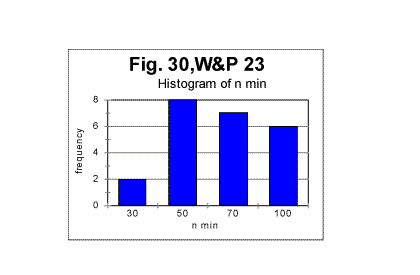
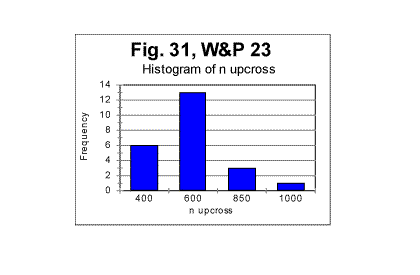
The mean value of the minimum point is nm =62.2 with a standard deviation of 24.3; the mean value of n for the upcross point is nu=624, with standard deviation of 229. (The test performed on the entire text of that novel (tested as one piece) revealed the overall minimum point at n=70 and the overall upcross point at n=700).
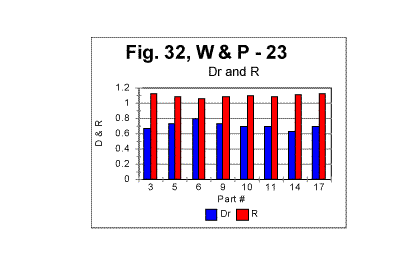
The assumption that the variations in minimum and crossover points between various segments are indeed due to the semantic variations in the text's contents, found a confirmation when the mean values of the ratio R=Sm/Se, as well as the values of "degree of randomness" - Dr introduced earlier, were compared for various segments. The results are illustrated in Fig. 32, which shows values of mean R and of Dr for various segments. The values of Dr and of mean R fluctuate insignificantly among the segments. Both Dr and mean R are sensitive to alphabet's and language's peculiarities, but are expected to be little sensitive to the semantic contents. (More detailed explanation of that statement will be given in the fourth part of this article). The variations in n for minimum or upcross points are much more pronounced - see Figs. 28 and 29.
For example, the value of n for the upcross point in segment #11 stands out as being quite higher than for the neighboring segments. However, neither the degree of randomness (as estimated by Dr coefficient ) nor the mean value of the ratio R=Sm/Se for that segment show any significant deviation from the neighboring segments (Fig. 32). Indeed, the value of Dr for segment #10 is the same 0.698 as it is for segment #11. The mean R for segment #10 is 1.095, while for segment #11 it is 1.082, which is also a small difference. Likewise, the value of n for the minimum point for segment #17 is twice as large as it is, for example, for segment # 14. However, the values of Dr differ little for these two segments, being 0.63 for #14 and 0.7 for # 17, while the values of mean R also vary insignificantly, being 1.11 and 1.13 for the two segments in question. Hence, the higher values n for the upcross point in segment #11 or for the minimum point in segment #17 are not connected to a language-based or alphabet-based peculiarity, but rather to the specific semantic contents of those segments.
Analyzing data of the type shown in Figs. 29 through 32 may facilitate the task of distinguishing between the effects of language and alphabet, on the one hand, and of the semantic contents, on the other.
2. Experiments with texts of varying lengths. Artificial long range order
The data presented and partially discussed in the previous sections of this article strongly indicate the presence of a considerable degree of order in meaningful texts as compared with randomized texts.
What has not yet been determined is the extent of that order, that is whether the texts possess only a short range order or also a long range order (these concepts had been discussed earlier in Part 2 of this article). To find an answer to that question (such an answer, besides being of interest by itself, would be also instrumental in interpreting the peaks observed on some Sm - n curves) it is desirable to obtain a text which would definitely possess a long range order and to compare its behavior to that of the regular texts.
A text possessing a long range order can be produced by choosing a certain segment of any regular text and creating a series of texts whose lengths would be gradually increased by adding to it repeatedly the same chosen segment. If the segment in question is chosen to have m letters, then when moving through the text from its beginning toward its end, after passing every m letters, the same segment of the text would be repeated, containing exactly the same words, and consequently the same letters in the same order, time and time again. Such a structure would model the structure of a perfect crystal where the same spatial configuration of atoms is repeated time and time again as one moves through the crystal.
Obviously, the behavior similar to a perfect crystal would emerge only when the size n of the chunk equals the size m of the chosen repeated segment: n=m. In that case the boundaries between the chunks (which determine the Letter Serial Correlation sums - see the pertinent discussion in Part 1) will coincide with the boundaries between identical segments of the text. As the contents of all chunks become identical, the Letter Serial Correlation sum, by definition, necessarily must drop to zero. As long though as n<m, the boundaries between the chunks do not coincide with the boundaries between the identical segments of the text, and hence the LSC sums are different from zero. But even for these, smaller than m values of n, the behavior of the text made up of repeated identical segments is expected to differ from the behavior of the regular text where the text varies from chunk to chunk in a much more variable way.
In the experiment we conducted, a segment of War and Peace in English was chosen containing 10000 letters. The series of texts with the gradually increased length consisted of 100 samples, whose lengths varied from 1 segment to 100 identical segments, that is from 10000 to 1000000 letters, each next sample longer than the previous one by one more segment, that is by 10000 letters. We will refer to that text as the Long Range Order text (or R-text). The behavior of the described text, which possessed a long range order, was compared with a regular text of the same War and Peace whose length gradually increased by adding one by one sequential (rather than identical) segments of the novel, each also of 10000 letters. We will refer to the latter text as Variable Length text (or S-text).
In Figs. 33 and 34 the graphs of the measured and expected sums vs chunk's size are shown both for the text whose total length was composed of 18 sequential segments of the War and Peace (in English) - text S, and for the text whose length was composed of 18 identical segments of 10000 letters each (text R). In both cases the overall length of texts was 180000 letters, in text S letters varying from segment to segment, and in text R the same sets of letters repeated 18 times.
The difference in the behavior of the two texts is evident. The most obvious feature of text R (Fig. 34) is the sharp drop of the measured LSC sum to zero when the chunk's size becomes equal the size of the repeated segment (in this case 10000 letters). As it was discussed earlier, this is a manifestation of the long range order that sets in when the chunk's length reaches the length of the repeated segment. For text S (Fig. 33) no such drop of the measured sum to zero takes place, the curve instead continuing its steady rise. This
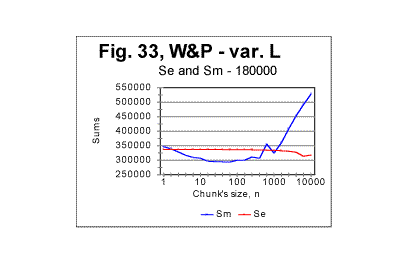
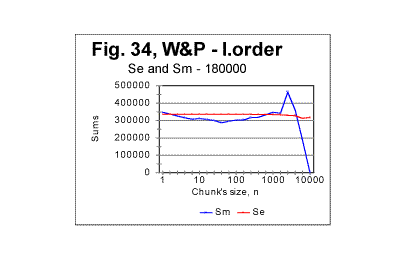
indicates that text S, which is actually a regular text of 1800000 letters, possesses no long range order (while the short range, which manifests itself in the regular shape of the curve with its typical downcross, mimimum, and upcross points, is strongly pronounced).
In Figs 35 through 37, the measured LSC sums are shown as functions of the text's overall length (which of course makes these graphs different from the previoiusly plotted sums vs chunk's size n). These graphs all represent the Sm-L dependencies for a constant chunks size, in this case n=5000. Very similar graphs were obtained for different chunk's sizes, between n=1 and n=7000. Fig 35 and 37 show the graphs for the range of lengths between 1 and 100000 letters, while Figs. 36 and 38 show them for the range between 100000 and 1000000 letters. Fig 35 and 36 relate to Variable Length texts, while Figs 37 and 38, to the Long Range Order texts of the same lengths, and created from the same original text of War and Peace.
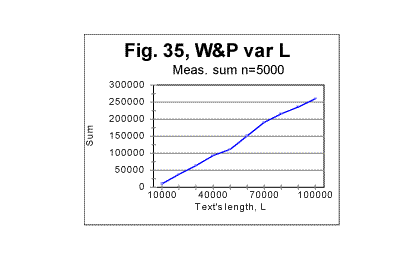
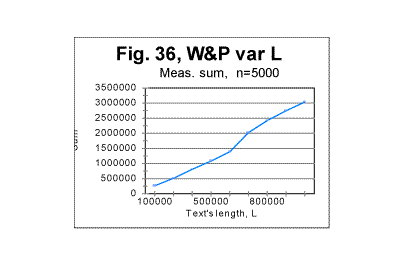
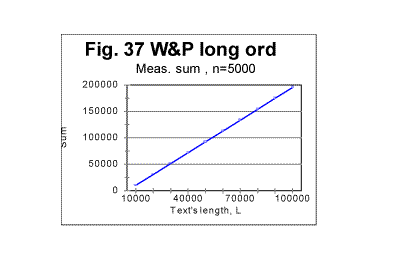
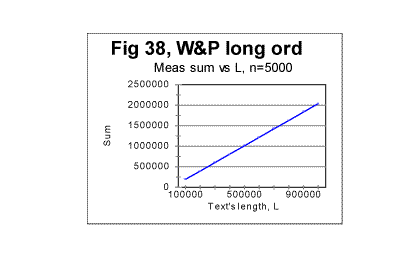
The difference between the Variable Length text and the Long Range order text is obvious: while the graphs for the Variable Length text show a variable slope of the Sm-n curve (reflecting variations of the text’s contents as its length increases) the graphs for the Long Range Order text appear to be straight lines, since the increase of length for these texts was achieved by repeating the same segment over and over. The observed difference gives one more clue in regard to the extent of the order in the texts. The results shown in Figs. 35 through 38 suggest that the regular texts, which, as we know from previous sections, definitely possess a considerable degree of order, apparently possess no long range order, but only a short range order. This conclusion will be tested by means of some other experiments we will describe below.
( Comment. For n=10000, which equals the size m of the chosen repeated segment, the measured LSC sum for the Long Range Order text, as it was explained above, was expected to be identically zero for all L. Indeed, the measurements revealed the expected zero values of Sm for all L, when n=m=10000. For the Variable Length text, Sm for n=10000 is different from zero, so the comparison of the graphs for the two versions in question, in the case of n=m=10000 becomes irelevant).
As the next step in unearthing the scope of order in regular texts, we compared the locations of the minimum points as well as the dependencies of the degree of randomness on the text’s lengths, for both the Variable Length texts and the Long Range Order texts.
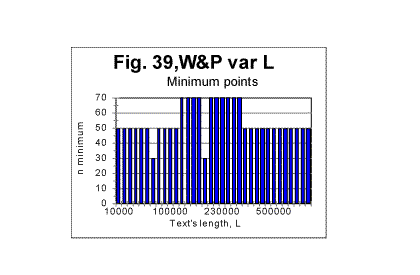
The minimum points locations in the Variable Length texts are shown in Fig. 39. This diagram shows that the most common location of the minimum point was found at n=50. However, for two text's lengths, the minimum point was found at n=30, and for 10 lengths (out of 100) the minimum point turned out to be at n=70. Since all the samples were in the same language, written by the same writer, and also since the samples with differing locations of minimum point were not clustered or situated in any discernable order, the natural explanation of the observed variations is that they were caused by variations in the text's semantic contents.
In the Long Range Order texts of all lengths, the location of the minimum point was invariably found at n=50 in all 100 samples. This again seems to indicate that the regular text, unlike the text comprising a series of identical segments, possesses no long range order, but only a short range order.
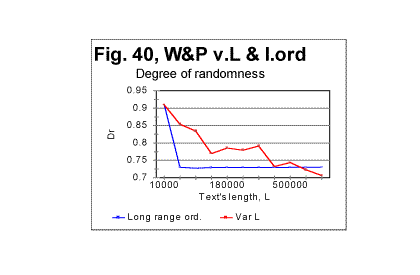
In Fig 40, the values of degree of randomness (introduced in Part 2 of this article) are shown both for the Variable Length text (red curve) and for the Long Range Order text (blue curve). The difference is obvious. When the length of the texts is only 10000 letters, which is just one segment in the Long Range Order version, both Long Range order and Variable Length order versions are the same initial part of the overall text and therefore naturally the value of Dr is the same for both versions. As soon as the length of the text increases, in one case by adding sequential segments, and in the other by adding identical segments, the behaviors of two versions substantially differ from each other. For the Long Range Order text, the value of degree of randomness drops at L>10000, and then remains constant for all values of L, reflecting the in-setting of the long range order. For the Variable Length text, the situation is profoundly different (see its discussion below) thus again pointing toward the absence of a long range order in the regular text (which was found earlier to possess a substantial level of a short range order).
Scrutinizing the curve for the Variable Length text (red curve in Fig. 40) we have to disntinguish between two features of that curve. One feature is the overall decrease of randomness as the text's length increases, and the second is the appearance of several local minima and maxima in the middle range of the lengths.
Analyzing the overall decrease of Dr when L increases, we found that the curve in question can be reasonably approximated by a power-type equation. The regression analysis applied to the log-log representation of the red curve in Fig. 40 led to the following equation in Dr-L coordinates: Dr=1.466ŚL-0.052 , with the correlation coefficient of k=0.967. The graph of the function in question is shown in Fig. 41 where the blue curve shows the measured Dr, and the red curve, the values of Dr as per the regression data. (The slight deviations of the red curve from a smooth run are not real but are due to the non-proportional graduation of the abscissa and disappear if a proportional scale is used).
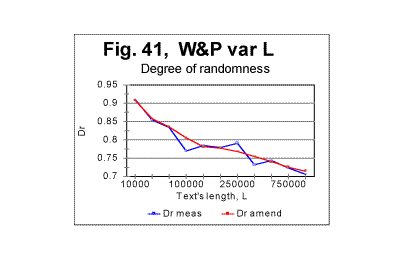
As can be seen from the above graph, as the text's length increases (due to addition of sequential segments of the text) the smoothed-out value of Dr consistently decreases. This indicates that the larger this text's length is, the more ordered it becomes.
The data shown in all previous graphs for that text led us to assume that the text in question possesses no long range order. While the data in Fig. 39 cannot refute the evidence shown in the preceding graphs, they nevertheless indicate that a certain amendment to our assumption of the absence of a long range order is required.
The evidence considered in previous sections had showed that all meaningful texts, unlike randomized ones, possess a strongly pronounced short range order. On the other hand, the evidence shown in Figs 33 through 37 indicated that there is a substantial difference between two types of texts of variable length. The text whose length was gradually increasing by adding repeatedly the same segment of text (text R) displayed, besides the short range order, also signs of the full-fledged long range order. The text whose length grew by addition of sequential segments (text S) showed no such signs. Now the aggregate evidence comprising both the data in Figs. 33 through 38 and those in Fig. 39 shows that the text whose length was increasing by adding sequential segments (text S) while not possessing the same level of a long range order as text R, shows nevertheless certain signs of a rudimentary long range order, manifesting itself in the decrease of Dr along with the increase of L. Since text S is actually a regular text of length L, we conclude that regular meaningful texts not only possess a full-fledged short range order but may also possess, to some degree, an imperfect long range order. Then an imperfect crystal rather than liquid can be considered a reasonable model for the meaningful text we studied. (A model for a randomized text is a gas). It can be surmised though that meaningful texts other than War and Peace, while all possessing a full-fledged short range order, may have different levels of the imperfect long range order. To verify that guess, several more texts other than War and Peace should be subjected to the test with the text's lengths increasing by adding alternatively sequential and repeated segments. It is possible that some texts may have a higher degree of a long range order, thus coming closer to the model of a good crystal (works of the old-fashioned rhymed poetry, especially rings of sonnets, seem to be good candidates) while some other texts, while possessing a strong short range order, may show negligible level of the long range order thus coming closer to a model of a liquid.
To understand the local minima/maxima on the red curve in Fig. 40, let us review Figs. 42 and 43 where the local peculiarities are juxtaposed for the curves of minima point locations and for the coefficient Dr - degree of randomness.
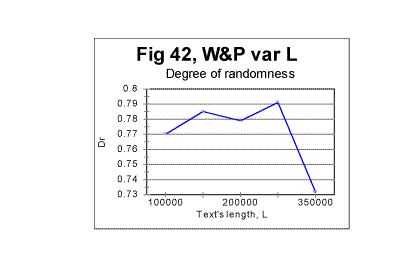
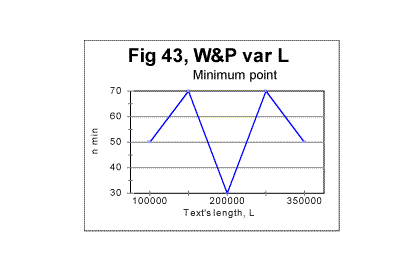
It can be seen that the minima and maxima on both graphs happen at the same values of L. While we cannot be sure that the coincidence of those text's lengths where both minimum points and Dr values display very similar peculiarities is a manifestation of an intrinsic connection between the two quantities, rather than a chance concidence, it seems nevertheless reasonable to attribute both phenomena to the same cause, namely to the specific variations in the text's semantic contents at the particular values of L. More detailed discussion of that attribution is found in Part 4 of this article (see http://www.talkreason.org/marperak/Texts/Serialcor4.htm ). In that Part 4, a discussion and interpretation of the data shown in part 1 ( Serialcor1.htm ) and in part 2 - see Serialcor2.htm , as well as in this part, are offered.